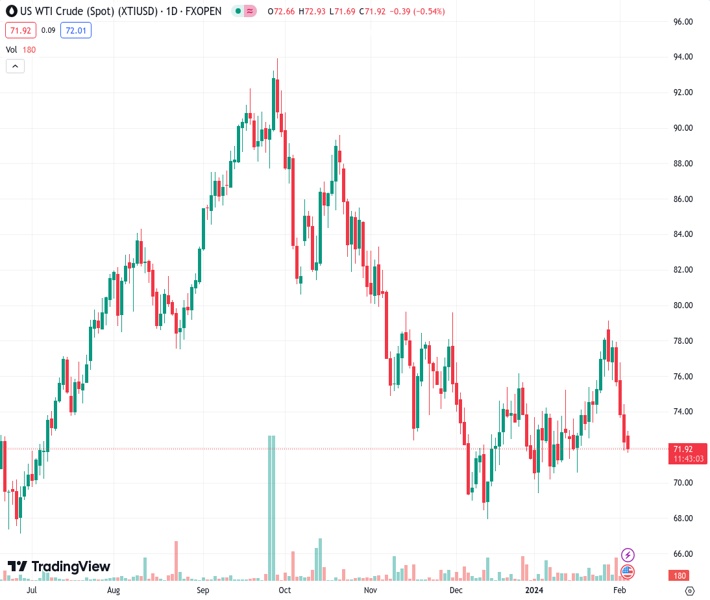
WTI drifts lower for the fourth straight day and drops to a near three-week low on Monday. (Pivot Orderbook analysis)
…
This is a premium post.
[s2If !current_user_can(access_s2member_level4)]Please register for FREE REGISTER to read full post below containing analysis. In case of any error or you think you are not able to read the full post below, please email us at support#nehcap.com [lwa][/s2If] [s2If current_user_can(access_s2member_level1)]
- WTI drifts lower for the fourth straight day and drops to a near three-week low on Monday.
- Bets for less aggressive rate cuts by the Fed underpin the USD and weigh on the black liquid.
- A further escalation of military action in the Middle East does little to ease the bearish pressure.
The pair currently trades last at 72.13.
The previous day high was 74.48 while the previous day low was 71.83. The daily 38.2% Fib levels comes at 72.84, expected to provide resistance. Similarly, the daily 61.8% fib level is at 73.47, expected to provide resistance.
West Texas Intermediate (WTI) US Crude Oil prices extend last week’s rejection slide from the 100-day Simple Moving Average (SMA), around the $79.20 area, or the YTD peak, and drift lower for the fourth successive day on Monday. This also marks the fifth day of a negative move in the previous six and drags the commodity to the $71.75-$71.70 region, or a nearly three-week low, during the first half of the European session.
The stronger-than-expected US jobs data released on Friday suggests that the economy may be too hot for the Federal Reserve (Fed) to start cutting interest rates. This continues to act as a tailwind for the US Dollar (USD) and turns out to be a key factor undermining demand for dollar-denominated commodities, including Crude Oil prices. Bulls, meanwhile, failed to gain any respite from fading hopes of a ceasefire between Israel and Hamas and the risk of a further escalation of military action in the Middle East.
Reports suggest that Hamas is set to reject the Gaza ceasefire deal proposed in Paris. Moreover, Israel’s Prime Minister Benjamin Netanyahu said that the country will not end the war before it completes all of its goals, which are the elimination of Hamas and the promise that Gaza will not pose a threat. Meanwhile, the US continues its campaign against the Iran-backed Houthis in Yemen and has signalled further strikes on Iran-backed groups in the Middle East in response to a deadly attack on American troops in Jordan.
The markets, meanwhile, react little to Ukrainian drone attacts on the largest oil refinery in southern Russia on Saturday as global supply remains largely unaffected. Furthermore, the commodity’s inability to attract any meaningful buying favours bearish traders and suggests that the path of least resistance remains to the downside. Traders now look to the release of the US ISM Services PMI, which, along with Fedspeaks, might influence the USD price dynamics and produce short-term opportunities around the black liquid.
Technical Levels: Supports and Resistances
XTIUSD currently trading at 72.13 at the time of writing. Pair opened at 72.17 and is trading with a change of -0.06 % .
| Overview | Overview.1 | |
|---|---|---|
| 0 | Today last price | 72.13 |
| 1 | Today Daily Change | -0.04 |
| 2 | Today Daily Change % | -0.06 |
| 3 | Today daily open | 72.17 |
The pair remains strongly bearish on the daily time frame. It trades below the 20 SMA @ 74.04, 50 SMA 73.35, 100 SMA @ 78.34 and 200 SMA @ 77.23.
| Trends | Trends.1 | |
|---|---|---|
| 0 | Daily SMA20 | 74.04 |
| 1 | Daily SMA50 | 73.35 |
| 2 | Daily SMA100 | 78.34 |
| 3 | Daily SMA200 | 77.23 |
The previous day high was 74.48 while the previous day low was 71.83. The daily 38.2% Fib levels comes at 72.84, expected to provide resistance. Similarly, the daily 61.8% fib level is at 73.47, expected to provide resistance.
Note the levels of interest below:
- Pivot support is noted at 71.17, 70.17, 68.52
- Pivot resistance is noted at 73.83, 75.48, 76.48
| Levels | Levels.1 |
|---|---|
| Previous Daily High | 74.48 |
| Previous Daily Low | 71.83 |
| Previous Weekly High | 79.19 |
| Previous Weekly Low | 71.83 |
| Previous Monthly High | 79.19 |
| Previous Monthly Low | 69.41 |
| Daily Fibonacci 38.2% | 72.84 |
| Daily Fibonacci 61.8% | 73.47 |
| Daily Pivot Point S1 | 71.17 |
| Daily Pivot Point S2 | 70.17 |
| Daily Pivot Point S3 | 68.52 |
| Daily Pivot Point R1 | 73.83 |
| Daily Pivot Point R2 | 75.48 |
| Daily Pivot Point R3 | 76.48 |
[/s2If]
Nehcap Trading Strategies
The NEHCAP currently runs the following trading systems for clients. They can be bought and run on your funds.
The system is trading live: LIVE ACCOUNT TRACKING
Contact Us: Contact
The HFT_FIX can be run free for 2 weeks on any broker with a ECN. Apply for a free trial
Join Our Telegram Group
")


