WTI oil price trims intraday gains despite escalated geopolitical tension in the Middle East. (Pivot Orderbook analysis)
…
This is a premium post.
[s2If !current_user_can(access_s2member_level4)]Please register for FREE REGISTER to read full post below containing analysis. In case of any error or you think you are not able to read the full post below, please email us at support#nehcap.com [lwa][/s2If] [s2If current_user_can(access_s2member_level1)]
- WTI oil price trims intraday gains despite escalated geopolitical tension in the Middle East.
- US and UK conducted new air strikes on the Houthi militant group in Yemen on Saturday.
- White House national security adviser, Jake Sullivan, expected the possibility of strikes on Iranian soil.
- Crude oil prices faced challenges after the release of solid US labor data on Friday.
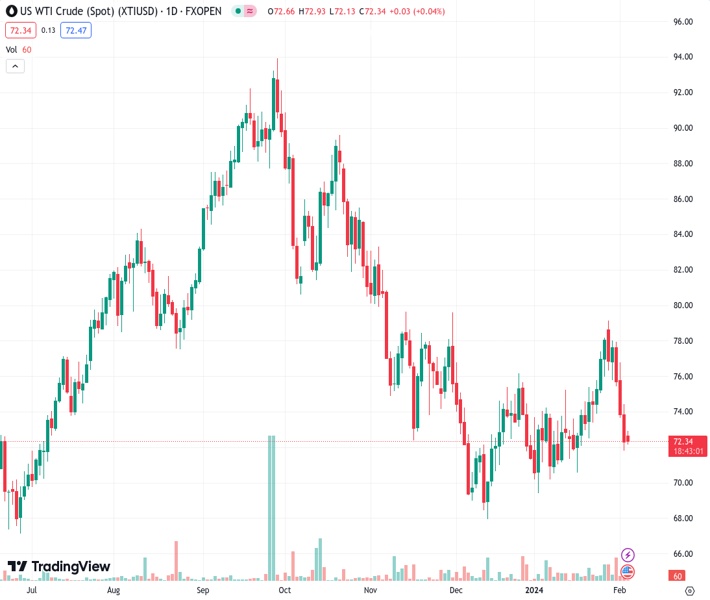
The pair currently trades last at 72.28.
The previous day high was 74.48 while the previous day low was 71.83. The daily 38.2% Fib levels comes at 72.84, expected to provide resistance. Similarly, the daily 61.8% fib level is at 73.47, expected to provide resistance.
West Texas Intermediate (WTI) oil price struggles to break a three-day losing streak on Monday. Crude oil prices have trimmed their intraday gains despite escalated geopolitical tension in the Middle East, where the United States (US) and the United Kingdom (UK) conducted new air strikes on the Iran-backed Houthi militant group in Yemen on Saturday. As of now, the WTI oil price trades around $72.30 per barrel during the Asian session.
The latest strikes were in response to a drone strike that resulted in the death of three US service members in Jordan. In retaliation, Yemen’s Houthi rebels have vowed to extend their military operations. Meanwhile, the White House national security adviser, Jake Sullivan, warned on Sunday that US airstrikes on Iranian-backed militias in the Middle East were just the beginning of a sustained response. Sullivan did not rule out the possibility of strikes on Iranian soil.
The blockbuster job data from the United States (US) has diminished the likelihood of March interest rate cuts by the Federal Reserve. The prospect of higher interest rates can have a dampening effect on economic growth and oil demand in major economies, leading to a decrease in Crude oil prices.
The Organization of the Petroleum Exporting Countries and its allies (OPEC+) are anticipated to encounter a long-term challenge in 2024 and 2025. This challenge stems from OPEC+ efforts to undercut global supply by implementing strict production quotas on member nations. However, the concern is that non-OPEC producers, including the United States, could potentially outstrip the OPEC+ supply cuts and oversupply global markets.
Technical Levels: Supports and Resistances
XTIUSD currently trading at 72.28 at the time of writing. Pair opened at 72.17 and is trading with a change of 0.15 % .
| Overview | Overview.1 | |
|---|---|---|
| 0 | Today last price | 72.28 |
| 1 | Today Daily Change | 0.11 |
| 2 | Today Daily Change % | 0.15 |
| 3 | Today daily open | 72.17 |
The pair remains strongly bearish on the daily time frame. It trades below the 20 SMA @ 74.04, 50 SMA 73.35, 100 SMA @ 78.34 and 200 SMA @ 77.23.
| Trends | Trends.1 | |
|---|---|---|
| 0 | Daily SMA20 | 74.04 |
| 1 | Daily SMA50 | 73.35 |
| 2 | Daily SMA100 | 78.34 |
| 3 | Daily SMA200 | 77.23 |
The previous day high was 74.48 while the previous day low was 71.83. The daily 38.2% Fib levels comes at 72.84, expected to provide resistance. Similarly, the daily 61.8% fib level is at 73.47, expected to provide resistance.
Note the levels of interest below:
- Pivot support is noted at 71.17, 70.17, 68.52
- Pivot resistance is noted at 73.83, 75.48, 76.48
| Levels | Levels.1 |
|---|---|
| Previous Daily High | 74.48 |
| Previous Daily Low | 71.83 |
| Previous Weekly High | 79.19 |
| Previous Weekly Low | 71.83 |
| Previous Monthly High | 79.19 |
| Previous Monthly Low | 69.41 |
| Daily Fibonacci 38.2% | 72.84 |
| Daily Fibonacci 61.8% | 73.47 |
| Daily Pivot Point S1 | 71.17 |
| Daily Pivot Point S2 | 70.17 |
| Daily Pivot Point S3 | 68.52 |
| Daily Pivot Point R1 | 73.83 |
| Daily Pivot Point R2 | 75.48 |
| Daily Pivot Point R3 | 76.48 |
[/s2If]
Nehcap Trading Strategies
The NEHCAP currently runs the following trading systems for clients. They can be bought and run on your funds.
The system is trading live: LIVE ACCOUNT TRACKING
Contact Us: Contact
The HFT_FIX can be run free for 2 weeks on any broker with a ECN. Apply for a free trial
Join Our Telegram Group
")


