WTI price loses ground despite an escalated tension in the Middle East. (Pivot Orderbook analysis)
…
This is a premium post.
[s2If !current_user_can(access_s2member_level4)]Please register for FREE REGISTER to read full post below containing analysis. In case of any error or you think you are not able to read the full post below, please email us at support#nehcap.com [lwa][/s2If] [s2If current_user_can(access_s2member_level1)]
- WTI price loses ground despite an escalated tension in the Middle East.
- US President Joe Biden mentioned a tiered approach to respond to a given situation after an attack on a US post in Jordon.
- Chinese Non-Manufacturing and Manufacturing PMI improved to 50.7 and 49.2, respectively in January.
- US Weekly Crude Oil Stock data showed a decrease of 2.50M barrels, larger than the expected decrease of 0.867M barrels.
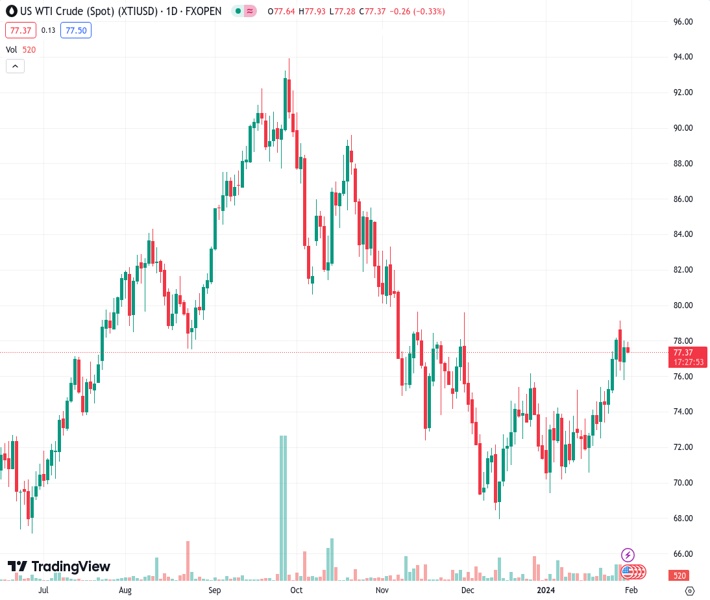
The pair currently trades last at 77.38.
The previous day high was 78.05 while the previous day low was 75.81. The daily 38.2% Fib levels comes at 77.19, expected to provide support. Similarly, the daily 61.8% fib level is at 76.67, expected to provide support.
West Texas Intermediate (WTI) oil price retraces its recent gains despite an escalated situation in the Middle East. The WTI oil price inches lower to near $77.40 per barrel during the Asian session on Wednesday. US President Joe Biden has stated that the United States (US) will respond appropriately to a given situation after an attack on a US post in Jordon, and there is a possibility of a tiered approach which implies a strategy involving different levels or stages of actions.
On the positive side, Iran-aligned Iraqi armed group Kataib Hezbollah, suspected of being involved in the deadly drone attack on US troops near the Jordan-Syria border, has declared the suspension of all its military operations against the US military in the region.
Crude oil prices may experience a positive impact following the recent update on global economic growth by the International Monetary Fund (IMF). The IMF has revised its forecast, indicating expectations of stronger growth, particularly in the economies of the United States and China. Furthermore, the Chinese monthly Non-Manufacturing Purchasing Managers’ Index (PMI) indicated an improvement in the performance of China’s service sector for January arrived at 50.7, slightly surpassing the expected figure of 50.6. While, the Manufacturing PMI reached 49.2, meeting the anticipated value and advancing from the previous reading of 49.
The American Petroleum Institute (API) released the US Weekly Crude Oil Stock data on Tuesday for the week ending January 26, showing a decrease of 2.50 million barrels. This marks a larger decline than the expected decrease of 0.867 million barrels, and it’s an improvement from the previous week’s decline of 6.674 million barrels. The Energy Information Administration (EIA) is anticipated to release improved Crude Oil Stocks Change figures on Wednesday. In addition to the oil market indicators, market participants will closely watch the Federal Reserve’s (Fed) activities for further insights into the US economic landscape.
Technical Levels: Supports and Resistances
XTIUSD currently trading at 77.38 at the time of writing. Pair opened at 77.74 and is trading with a change of -0.46 % .
| Overview | Overview.1 | |
|---|---|---|
| 0 | Today last price | 77.38 |
| 1 | Today Daily Change | -0.36 |
| 2 | Today Daily Change % | -0.46 |
| 3 | Today daily open | 77.74 |
The pair is trading above its 20 Daily moving average @ 73.93, above its 50 Daily moving average @ 73.5 , below its 100 Daily moving average @ 78.81 and above its 200 Daily moving average @ 77.25
| Trends | Trends.1 | |
|---|---|---|
| 0 | Daily SMA20 | 73.93 |
| 1 | Daily SMA50 | 73.50 |
| 2 | Daily SMA100 | 78.81 |
| 3 | Daily SMA200 | 77.25 |
The previous day high was 78.05 while the previous day low was 75.81. The daily 38.2% Fib levels comes at 77.19, expected to provide support. Similarly, the daily 61.8% fib level is at 76.67, expected to provide support.
Note the levels of interest below:
- Pivot support is noted at 76.35, 74.96, 74.11
- Pivot resistance is noted at 78.59, 79.44, 80.83
| Levels | Levels.1 |
|---|---|
| Previous Daily High | 78.05 |
| Previous Daily Low | 75.81 |
| Previous Weekly High | 78.20 |
| Previous Weekly Low | 72.55 |
| Previous Monthly High | 76.79 |
| Previous Monthly Low | 67.97 |
| Daily Fibonacci 38.2% | 77.19 |
| Daily Fibonacci 61.8% | 76.67 |
| Daily Pivot Point S1 | 76.35 |
| Daily Pivot Point S2 | 74.96 |
| Daily Pivot Point S3 | 74.11 |
| Daily Pivot Point R1 | 78.59 |
| Daily Pivot Point R2 | 79.44 |
| Daily Pivot Point R3 | 80.83 |
[/s2If]
Nehcap Trading Strategies
The NEHCAP currently runs the following trading systems for clients. They can be bought and run on your funds.
The system is trading live: LIVE ACCOUNT TRACKING
Contact Us: Contact
The HFT_FIX can be run free for 2 weeks on any broker with a ECN. Apply for a free trial
Join Our Telegram Group
")


