Gold price jumps further on deepening Middle East tensions.
…
This is a premium post.
[s2If !current_user_can(access_s2member_level4)]Please register for FREE REGISTER to read full post below containing analysis. In case of any error or you think you are not able to read the full post below, please email us at support#nehcap.com [lwa][/s2If] [s2If current_user_can(access_s2member_level1)]
- Gold price jumps further on deepening Middle East tensions.
- Investors brace for Fed policy decision and US labor and Manufacturing PMI data.
- Fed’s outlook on interest rates will be in focus.
Gold price (XAU/USD) continues to advance amid the escalating Middle East crisis as US President Joe Biden has pledged to retaliate for unmanned aerial drone attacks on US service personnel near northeastern Jordan, near the Syrian border. Still, the precious metal could turn sideways as investors await the interest rate decision by the Federal Reserve (Fed), which will be announced on Wednesday.
Traders see the Fed holding interest rates in the range of 5.25%-5.50% amid consistently easing price pressures. Investors will focus on the timing at which Fed policymakers are comfortable for commencing the rate-cut campaign. The Fed is not confident yet that underlying inflation will sustainably return to 2% due to strong labor demand, robust Retail Sales, and a broadly upbeat economic outlook.
This week, investors will remain busy as various economic indicators from the US are lined-up for release. The ADP Employment Change will be released on Wednesday, just before the Fed’s policy announcement. These will be followed by the Institute for Supply Management (ISM) Manufacturing PMI on Thursday and Nonfarm Payrolls (NFP) data on Friday.
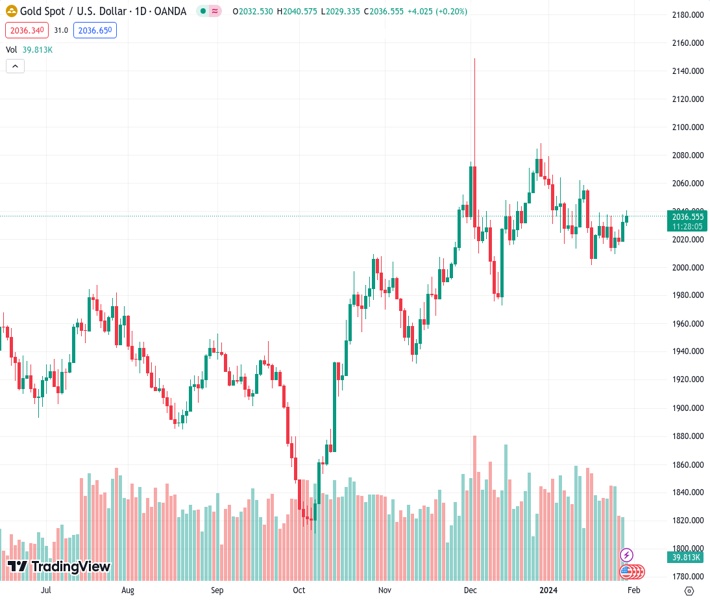
Gold price rises to near $2,040, supported by geopolitical tensions. The precious metal has strengthened after delivering a breakout of the Symmetrical Triangle chart pattern formed on a daily time frame. A breakout of the aforementioned chart pattern indicates a volatility expansion, which results in wider ticks and heavy volume. The near-term appeal has turned bullish as price is sustaining strongly above the 20-day Exponential Moving Average (EMA).
However, the 14-period Relative Strength Index (RSI) oscillates in the 40.00-60.00 area, which indicates that momentum is weak.
[/s2If]
Nehcap Trading Strategies
The NEHCAP currently runs the following trading systems for clients. They can be bought and run on your funds.
The system is trading live: LIVE ACCOUNT TRACKING
Contact Us: Contact
The HFT_FIX can be run free for 2 weeks on any broker with a ECN. Apply for a free trial
Join Our Telegram Group
")


