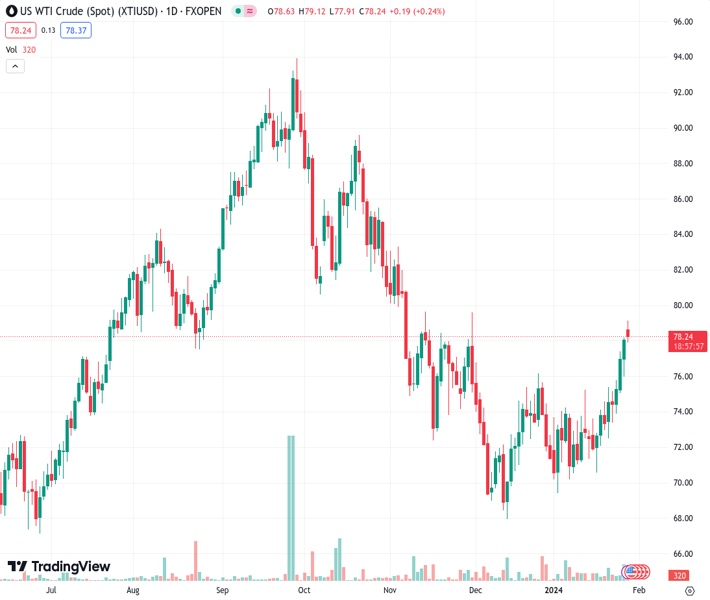
WTI price gained ground on the threat of supply disruption in the Red Sea. (Pivot Orderbook analysis)
…
This is a premium post.
[s2If !current_user_can(access_s2member_level4)]Please register for FREE REGISTER to read full post below containing analysis. In case of any error or you think you are not able to read the full post below, please email us at support#nehcap.com [lwa][/s2If] [s2If current_user_can(access_s2member_level1)]
- WTI price gained ground on the threat of supply disruption in the Red Sea.
- Crude oil prices surged as a drone attacked a US outpost in Jordan on Sunday.
- US military could carry out strikes into Iran.
- OPEC+ will hold an online conference on February 1 to decide on further output policies.
The pair currently trades last at 78.32.
The previous day high was 78.2 while the previous day low was 76.02. The daily 38.2% Fib levels comes at 77.36, expected to provide support. Similarly, the daily 61.8% fib level is at 76.85, expected to provide support.
West Texas Intermediate (WTI) oil price extends its gains for the fourth consecutive session, trading higher near $78.30 per barrel on Monday, by the press time. WTI prices reached the monthly peak at $79.19 during the early Asian hours but have since pared some of their intraday gains. However, the surge in Crude oil prices was driven by concerns about potential supply disruptions following a missile attack on a fuel tanker in the Red Sea.
Moreover, on Sunday, a drone attack targeted a United States (US) outpost in Jordan, near its border with Syria, resulting in the tragic death of three US service members and leaving at least 24 others injured. Reports indicate that both the administration of US President Joe Biden and the US military are actively developing specific plans to address this attack. Among the potential measures being considered, there is the serious prospect of carrying out strikes in Iran, representing a significant escalation if such actions are implemented, which in turn, may act as a tailwind for the Crude oil prices.
The Organization of the Petroleum Exporting Countries and its allies (OPEC+) are scheduled to hold an online conference on February 1, where they may make decisions regarding further output policies. Currently, OPEC+ has collectively committed to voluntary output cuts of approximately 2.2 million barrels per day (bpd) for the first quarter, with Saudi Arabia leading by maintaining a 1 million bpd voluntary reduction. However, Gazprom Neft, a major Russian oil producer, holds the view that there is no necessity for additional cuts in oil supply by OPEC+ members. Meanwhile, the prognosis for Russian refined products exports is anticipated to decrease due to ongoing repairs at several refineries following drone attacks.
Crude oil prices might have received upward support, partially fueled by the better-than-expected GDP Annualized (Q4) data released from the United States last week. Another contributing factor to the strength in Crude oil prices is speculation surrounding the People’s Bank of China (PBoC) contemplating a potential cut in the Medium-term Lending Facility (MLF) rate, given that China, as the largest oil importer, wields a substantial influence on global oil markets.
Technical Levels: Supports and Resistances
XTIUSD currently trading at 78.32 at the time of writing. Pair opened at 78.09 and is trading with a change of 0.29 % .
| Overview | Overview.1 | |
|---|---|---|
| 0 | Today last price | 78.32 |
| 1 | Today Daily Change | 0.23 |
| 2 | Today Daily Change % | 0.29 |
| 3 | Today daily open | 78.09 |
The pair is trading above its 20 Daily moving average @ 73.3, above its 50 Daily moving average @ 73.51 , below its 100 Daily moving average @ 79.01 and above its 200 Daily moving average @ 77.26
| Trends | Trends.1 | |
|---|---|---|
| 0 | Daily SMA20 | 73.30 |
| 1 | Daily SMA50 | 73.51 |
| 2 | Daily SMA100 | 79.01 |
| 3 | Daily SMA200 | 77.26 |
The previous day high was 78.2 while the previous day low was 76.02. The daily 38.2% Fib levels comes at 77.36, expected to provide support. Similarly, the daily 61.8% fib level is at 76.85, expected to provide support.
Note the levels of interest below:
- Pivot support is noted at 76.67, 75.25, 74.49
- Pivot resistance is noted at 78.85, 79.61, 81.03
| Levels | Levels.1 |
|---|---|
| Previous Daily High | 78.20 |
| Previous Daily Low | 76.02 |
| Previous Weekly High | 78.20 |
| Previous Weekly Low | 72.55 |
| Previous Monthly High | 76.79 |
| Previous Monthly Low | 67.97 |
| Daily Fibonacci 38.2% | 77.36 |
| Daily Fibonacci 61.8% | 76.85 |
| Daily Pivot Point S1 | 76.67 |
| Daily Pivot Point S2 | 75.25 |
| Daily Pivot Point S3 | 74.49 |
| Daily Pivot Point R1 | 78.85 |
| Daily Pivot Point R2 | 79.61 |
| Daily Pivot Point R3 | 81.03 |
[/s2If]
Nehcap Trading Strategies
The NEHCAP currently runs the following trading systems for clients. They can be bought and run on your funds.
The system is trading live: LIVE ACCOUNT TRACKING
Contact Us: Contact
The HFT_FIX can be run free for 2 weeks on any broker with a ECN. Apply for a free trial
Join Our Telegram Group
")


