WTI price is expected to close the week in a positive territory due to multiple factors. (Pivot Orderbook analysis)
…
This is a premium post.
[s2If !current_user_can(access_s2member_level4)]Please register for FREE REGISTER to read full post below containing analysis. In case of any error or you think you are not able to read the full post below, please email us at support#nehcap.com [lwa][/s2If] [s2If current_user_can(access_s2member_level1)]
- WTI price is expected to close the week in a positive territory due to multiple factors.
- US GDP data contributed support to reinforcing the Crude oil prices.
- PBoC’s strategy to inject liquidity into the economy contributes to the strength in oil prices.
- Chinese officials asked their Iranian counterparts to help restrain attacks on ships in the Red Sea.
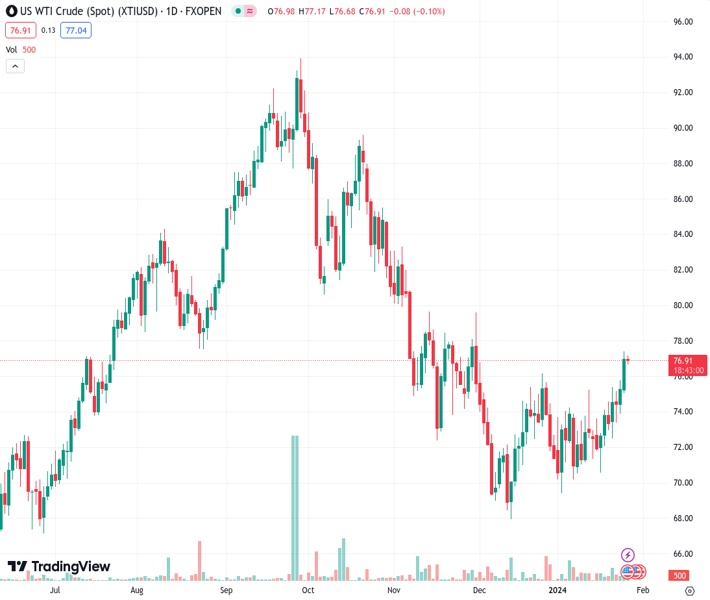
The pair currently trades last at 76.98.
The previous day high was 77.45 while the previous day low was 75.13. The daily 38.2% Fib levels comes at 76.57, expected to provide support. Similarly, the daily 61.8% fib level is at 76.02, expected to provide support.
West Texas Intermediate (WTI) oil price pauses its two-day winning streak but is anticipated to conclude the week on a positive note, trading near $77.00 per barrel during the Asian session on Friday. However, the Crude oil prices received a positive momentum, which is attributed, in part, to the better-than-expected GDP Annualized (Q4) released from the United States on Thursday.
Additionally, the strength in Crude oil prices can be attributed to various factors, notably speculation surrounding the People’s Bank of China (PBoC) considering a Medium-term Lending Facility (MLF) rate cut. This speculation has gained momentum following a recent statement by PBoC Governor Pan Gongsheng, who announced a reduction in the Required Reserve Ratio (RRR) by 50 basis points starting from February 5th. The RRR cut is part of the central bank’s strategy to inject liquidity into the economy, with the move expected to release approximately CNY 1 trillion of extra funds. This contributes to the strength in Crude oil prices, considering the fact that China, being the largest oil importer, plays a significant role in influencing global oil markets.
The geopolitical tensions in the Middle East are contributing to the support of oil prices, causing them to edge higher. The leader of the Houthi group stated on Thursday that they would persist in targeting ships associated with Israel until aid reaches the Palestinian people in Gaza. Notably, Chinese officials have intervened, urging their Iranian counterparts to help restrain attacks on ships in the Red Sea by the Iran-backed Houthis. The potential disruption to business relations with Beijing was emphasized.
Moreover, the upward movement in the WTI oil price is further supported by a decrease in US crude oil stockpiles. According to the Energy Information Administration (EIA), the Crude Oil Stocks Change showed a significant decrease compared to the prior week’s drop. Additionally, the severe weather conditions disrupted crude oil production and transportation, especially in North Dakota, leading to fluctuations in inventory levels. The business barometer for the drilling industry and its suppliers, Baker Hughes US Oil Rig Count will be released on Friday, along with the US Personal Consumption Expenditures (PCE) Price Index data.
Technical Levels: Supports and Resistances
XTIUSD currently trading at 76.98 at the time of writing. Pair opened at 77.17 and is trading with a change of -0.25 % .
| Overview | Overview.1 | |
|---|---|---|
| 0 | Today last price | 76.98 |
| 1 | Today Daily Change | -0.19 |
| 2 | Today Daily Change % | -0.25 |
| 3 | Today daily open | 77.17 |
The pair is trading above its 20 Daily moving average @ 72.97, above its 50 Daily moving average @ 73.47 , below its 100 Daily moving average @ 79.1 and below its 200 Daily moving average @ 77.26
| Trends | Trends.1 | |
|---|---|---|
| 0 | Daily SMA20 | 72.97 |
| 1 | Daily SMA50 | 73.47 |
| 2 | Daily SMA100 | 79.10 |
| 3 | Daily SMA200 | 77.26 |
The previous day high was 77.45 while the previous day low was 75.13. The daily 38.2% Fib levels comes at 76.57, expected to provide support. Similarly, the daily 61.8% fib level is at 76.02, expected to provide support.
Note the levels of interest below:
- Pivot support is noted at 75.72, 74.26, 73.4
- Pivot resistance is noted at 78.04, 78.91, 80.36
| Levels | Levels.1 |
|---|---|
| Previous Daily High | 77.45 |
| Previous Daily Low | 75.13 |
| Previous Weekly High | 74.60 |
| Previous Weekly Low | 70.63 |
| Previous Monthly High | 76.79 |
| Previous Monthly Low | 67.97 |
| Daily Fibonacci 38.2% | 76.57 |
| Daily Fibonacci 61.8% | 76.02 |
| Daily Pivot Point S1 | 75.72 |
| Daily Pivot Point S2 | 74.26 |
| Daily Pivot Point S3 | 73.40 |
| Daily Pivot Point R1 | 78.04 |
| Daily Pivot Point R2 | 78.91 |
| Daily Pivot Point R3 | 80.36 |
[/s2If]
Nehcap Trading Strategies
The NEHCAP currently runs the following trading systems for clients. They can be bought and run on your funds.
The system is trading live: LIVE ACCOUNT TRACKING
Contact Us: Contact
The HFT_FIX can be run free for 2 weeks on any broker with a ECN. Apply for a free trial
Join Our Telegram Group
")


