Crude Oil market climbed as geopolitical headlines squeeze barrel bids higher. (Pivot Orderbook analysis)
…
This is a premium post.
[s2If !current_user_can(access_s2member_level4)]Please register for FREE REGISTER to read full post below containing analysis. In case of any error or you think you are not able to read the full post below, please email us at support#nehcap.com [lwa][/s2If] [s2If current_user_can(access_s2member_level1)]
- Crude Oil market climbed as geopolitical headlines squeeze barrel bids higher.
- EIA reported a steeper-than-expected decline in US crude barrel counts.
- MIlitary strikes against Houthi rebels are increasing supply line concerns.
The pair currently trades last at 73.98.
The previous day high was 72.76 while the previous day low was 70.63. The daily 38.2% Fib levels comes at 71.95, expected to provide support. Similarly, the daily 61.8% fib level is at 71.44, expected to provide support.
West Texas Intermediate (WTI) US Crude Oil climbed to $74.00 per barrel on Thursday, rising after Crude Oil supplies in the US saw a steeper drawdown than markets expected according to barrel counts by the Energy Information Administration (EIA). Iran-backed Houthi rebels have vowed to step up attacks on civilian cargo ships passing through the Red Sea after an uptick in US-UK coalition naval strikes on Houthi-controlled missile launch sites in Yemen.
The EIA reported a 2.492 million barrel drawdown in US Crude Oil Stocks Change for the week ended January 12, a significant pullback from the market forecast of 313K and completely eating away at the previous week’s 1.338 million barrel buildup. Refinery demand has peaked as petroleum refiners scramble for more Crude Oil despite a growing overhang in downstream oil products, and US Crude Oil production output steadily rising into new all-time highs could limit topside momentum on hypothetical supply concerns.
Geopolitics continue to plague energy markets, with Crude Oil helped higher on the week by a notable uptick in violent rhetoric from Houthi rebels in Yemen after a wave of naval attacks on Houthi-controlled missile launch sites in Yemen. Despite the ongoing presence of US and UK coalition warships in the Red Sea, Houthis are vowing to continue or increase their attacks on civilian tankers trying to reach the Suez Canal instead of rerouting around the continent of Africa.
Crude Oil markets are increasingly concerned that Europe-Asia energy supply lines could become crimped as tensions and conflict escalate in the region.
Cold weather also saw a slight drawdown in US oil production, with the EIA estimating that US gasoline production average 9.4 million barrels per day for the week ended January 12 compared to 9.7 million bpd the week prior.
The EIA estimated that processed Gasoline reserves climbed by 3.1 million barrels for the week, with an additional 2.4 million barrel buildup in middle distillates adding to the previous week’s 6.5 million barrel supply increase.
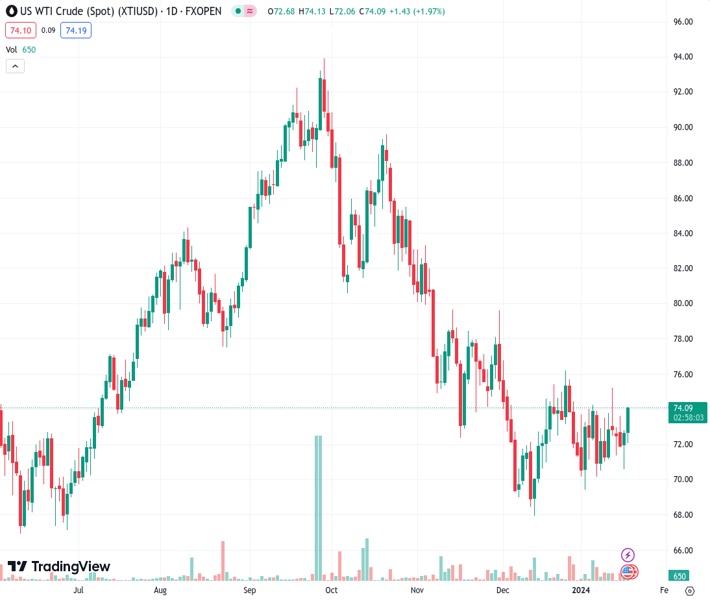
US Crude Oil is back into the top end of recent congestion in the WTI chart, trading into $74.00 for the fourth time since kicking off 2024 near $72.00.
Daily candlesticks reveal a long-term rough consolidation zone forming in WTI, with US Crude Oil bidding into familiar levels since a limited rebound after declining nearly 28% top-to-bottom from September’s peak just shy of $94.00 per barrel.
WTI bottomed out near $68.00 in mid-December, and barrel bids have been hung inside a sideways grind between $70.00 and $76.00 for seven consecutive weeks.
Technical Levels: Supports and Resistances
XTIUSD currently trading at 73.98 at the time of writing. Pair opened at 72.74 and is trading with a change of 1.7 % .
| Overview | Overview.1 | |
|---|---|---|
| 0 | Today last price | 73.98 |
| 1 | Today Daily Change | 1.24 |
| 2 | Today Daily Change % | 1.70 |
| 3 | Today daily open | 72.74 |
The pair is trading above its 20 Daily moving average @ 72.63, above its 50 Daily moving average @ 73.67 , below its 100 Daily moving average @ 79.74 and below its 200 Daily moving average @ 77.42
| Trends | Trends.1 | |
|---|---|---|
| 0 | Daily SMA20 | 72.63 |
| 1 | Daily SMA50 | 73.67 |
| 2 | Daily SMA100 | 79.74 |
| 3 | Daily SMA200 | 77.42 |
The previous day high was 72.76 while the previous day low was 70.63. The daily 38.2% Fib levels comes at 71.95, expected to provide support. Similarly, the daily 61.8% fib level is at 71.44, expected to provide support.
Note the levels of interest below:
- Pivot support is noted at 71.32, 69.9, 69.18
- Pivot resistance is noted at 73.46, 74.18, 75.6
| Levels | Levels.1 |
|---|---|
| Previous Daily High | 72.76 |
| Previous Daily Low | 70.63 |
| Previous Weekly High | 75.28 |
| Previous Weekly Low | 70.21 |
| Previous Monthly High | 76.79 |
| Previous Monthly Low | 67.97 |
| Daily Fibonacci 38.2% | 71.95 |
| Daily Fibonacci 61.8% | 71.44 |
| Daily Pivot Point S1 | 71.32 |
| Daily Pivot Point S2 | 69.90 |
| Daily Pivot Point S3 | 69.18 |
| Daily Pivot Point R1 | 73.46 |
| Daily Pivot Point R2 | 74.18 |
| Daily Pivot Point R3 | 75.60 |
[/s2If]
Nehcap Trading Strategies
The NEHCAP currently runs the following trading systems for clients. They can be bought and run on your funds.
The system is trading live: LIVE ACCOUNT TRACKING
Contact Us: Contact
The HFT_FIX can be run free for 2 weeks on any broker with a ECN. Apply for a free trial
Join Our Telegram Group
")


