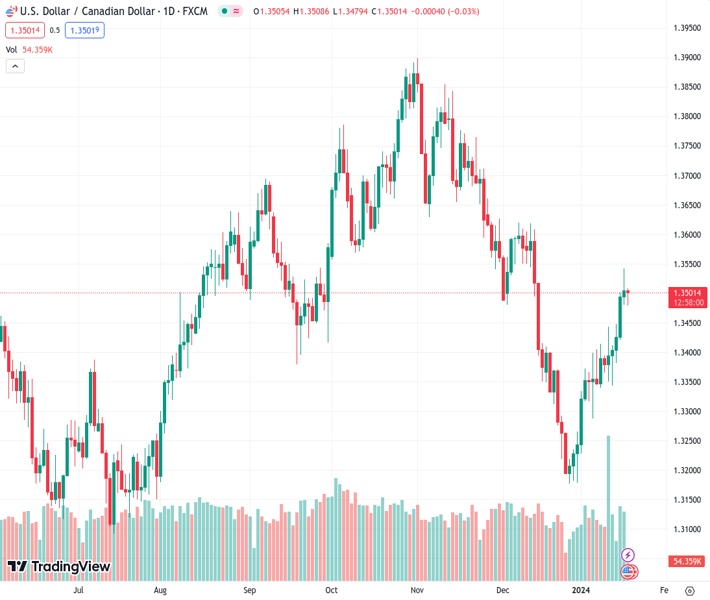
#USDCAD @ 1.34996 tries to snap its five-day winning streak on a subdued US Dollar. (Pivot Orderbook analysis)
…
This is a premium post.
[s2If !current_user_can(access_s2member_level4)]Please register for FREE REGISTER to read full post below containing analysis. In case of any error or you think you are not able to read the full post below, please email us at support#nehcap.com [lwa][/s2If] [s2If current_user_can(access_s2member_level1)]
- USD/CAD tries to snap its five-day winning streak on a subdued US Dollar.
- A break below the seven-day EMA at 1.3456 could lead the pair to test the 1.3400 psychological level.
- The pair could find resistance around 50% retracement level at 1.3536 followed by the support at 1.3550.
The pair currently trades last at 1.34996.
The previous day high was 1.3542 while the previous day low was 1.348. The daily 38.2% Fib levels comes at 1.3518, expected to provide resistance. Similarly, the daily 61.8% fib level is at 1.3504, expected to provide resistance.
USD/CAD attempts to break its five-day winning streak, trading lower around the 1.3500 psychological level during the European session on Thursday. A break below the psychological level could put pressure on the pair to navigate the region around the seven-day Exponential Moving Average (EMA) at 1.3456 aligned with the major support at 1.3450 level.
If the USD/CAD pair surpasses the support region, it could be influenced to approach the psychological level at 1.3400.
However, the technical analysis of the Moving Average Convergence Divergence (MACD) for the USD/CAD pair indicates a potential bullish sentiment in the market, as the MACD line is positioned above the centerline and exhibits divergence above the signal line.
Additionally, the lagging indicator, the 14-day Relative Strength Index (RSI), is positioned above 50, suggesting the confirmation of stronger momentum for the USD/CAD pair.
The analysis indicates that on the upside, the USD/CAD pair faces potential barriers, with the 50% retracement level at 1.3536 serving as an immediate obstacle. Beyond that, a significant resistance level stands at 1.3550.
If the pair manages to break above the latter, it could encourage bullish momentum, potentially leading to an exploration of the psychological resistance region around 1.3600. Further upward movement might target the 61.8% Fibonacci retracement level at 1.3622.
Technical Levels: Supports and Resistances
USDCAD currently trading at 1.3499 at the time of writing. Pair opened at 1.3512 and is trading with a change of -0.1 % .
| Overview | Overview.1 | |
|---|---|---|
| 0 | Today last price | 1.3499 |
| 1 | Today Daily Change | -0.0013 |
| 2 | Today Daily Change % | -0.1000 |
| 3 | Today daily open | 1.3512 |
The pair is trading above its 20 Daily moving average @ 1.3336, above its 50 Daily moving average @ 1.3495 , below its 100 Daily moving average @ 1.3568 and above its 200 Daily moving average @ 1.348
| Trends | Trends.1 | |
|---|---|---|
| 0 | Daily SMA20 | 1.3336 |
| 1 | Daily SMA50 | 1.3495 |
| 2 | Daily SMA100 | 1.3568 |
| 3 | Daily SMA200 | 1.3480 |
The previous day high was 1.3542 while the previous day low was 1.348. The daily 38.2% Fib levels comes at 1.3518, expected to provide resistance. Similarly, the daily 61.8% fib level is at 1.3504, expected to provide resistance.
Note the levels of interest below:
- Pivot support is noted at 1.3481, 1.345, 1.342
- Pivot resistance is noted at 1.3543, 1.3573, 1.3604
| Levels | Levels.1 |
|---|---|
| Previous Daily High | 1.3542 |
| Previous Daily Low | 1.3480 |
| Previous Weekly High | 1.3443 |
| Previous Weekly Low | 1.3341 |
| Previous Monthly High | 1.3620 |
| Previous Monthly Low | 1.3178 |
| Daily Fibonacci 38.2% | 1.3518 |
| Daily Fibonacci 61.8% | 1.3504 |
| Daily Pivot Point S1 | 1.3481 |
| Daily Pivot Point S2 | 1.3450 |
| Daily Pivot Point S3 | 1.3420 |
| Daily Pivot Point R1 | 1.3543 |
| Daily Pivot Point R2 | 1.3573 |
| Daily Pivot Point R3 | 1.3604 |
[/s2If]
Nehcap Trading Strategies
The NEHCAP currently runs the following trading systems for clients. They can be bought and run on your funds.
The system is trading live: LIVE ACCOUNT TRACKING
Contact Us: Contact
The HFT_FIX can be run free for 2 weeks on any broker with a ECN. Apply for a free trial
Join Our Telegram Group
")


