European stocks climbed, bolstered by improving risk appetite on rate cut hopes. (Pivot Orderbook analysis)
…
This is a premium post.
[s2If !current_user_can(access_s2member_level4)]Please register for FREE REGISTER to read full post below containing analysis. In case of any error or you think you are not able to read the full post below, please email us at support#nehcap.com [lwa][/s2If] [s2If current_user_can(access_s2member_level1)]
- European stocks climbed, bolstered by improving risk appetite on rate cut hopes.
- The UK saw a slight return to growth as UK GDP rebounds.
- US PPI fell more than expected, driving sentiment even higher.
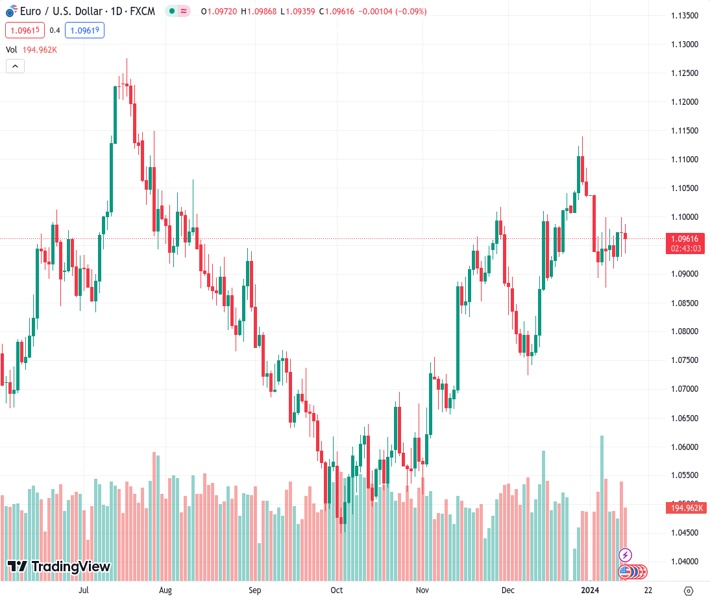
The pair currently trades last at 7630.89.
The previous day high was 7696.43 while the previous day low was 7570.6. The daily 38.2% Fib levels comes at 7618.67, expected to provide support. Similarly, the daily 61.8% fib level is at 7648.36, expected to provide resistance.
Major European equity indexes broadly gained ground on Friday, stepping up ahead of the trading week’s close after UK Gross Domestic Product (GDP) grew more than expected. Bullish sentiment was sent even higher at the outset of the US trading session after US Producer Price Index (PPI) figures also fell below expectations, increasing bets of a sooner rate cut from the Federal Reserve (Fed).
UK GDP came in at 0.3% in November versus the forecast 0.2% rebound from October’s -0.3%, helping to spark a mild bull run in hesitant European markets.
The bullish sentiment swing pinned further into the high end after US PPI figures broadly slumped, with producer-level inflation cooling more than expected, sending a spike through money market expectations of an accelerated pace of rate cuts from the Fed, with investors now pricing in around 160 basis points in rate cuts through 2024 compared to yesterday’s upper limit of 154 bps.
Next week sees European Industrial Production for November, slated to print Monday, while Tuesday brings UK labor and wage earnings. UK Employment Change last came in at 50K in October, while Average Earnings is expected to fall back in both the Including & Excluding Bonuses, with Average Earnings Including Bonuses forecast to decline from 7.2% to 6.8% for the annualized quarter ended November.
Germany’s DAX climbed 0.95%, closing at €16,704.56, up by 0.95%, while France’s CAC 40 gained 1.05%, climbing 77.52 points to €7,465.14.
The pan-European STOXX600 index gained just under 4 points to climb 0.84% into €476.76, while London’s FTSEO major index rose 0.64% to close up 48.34 points at £7,624.93.
Despite a moderate gain on Friday, the FTSE 100 major London equity index is still off of recent highs, down from late December’s seven-month high of £7,763.54, slipping back into the 200-day Simple Moving Average (SMA) near £7,572.
Near-term action sees the FTSE 100 drifting steadily lower after slumping below the 200-hour SMA near the £7,700 handle, and the index continues to grind lower in lockstep with a bearish 50-hour SMA that confirmed a bearish cross off the 200-hour SMA near £7,670.
Technical Levels: Supports and Resistances
EURUSD currently trading at 7630.89 at the time of writing. Pair opened at 7595.14 and is trading with a change of 0.47 % .
| Overview | Overview.1 | |
|---|---|---|
| 0 | Today last price | 7630.89 |
| 1 | Today Daily Change | 35.75 |
| 2 | Today Daily Change % | 0.47 |
| 3 | Today daily open | 7595.14 |
The pair is trading below its 20 Daily moving average @ 7677.37, above its 50 Daily moving average @ 7554.85 , above its 100 Daily moving average @ 7530.78 and above its 200 Daily moving average @ 7573.59
| Trends | Trends.1 | |
|---|---|---|
| 0 | Daily SMA20 | 7677.37 |
| 1 | Daily SMA50 | 7554.85 |
| 2 | Daily SMA100 | 7530.78 |
| 3 | Daily SMA200 | 7573.59 |
The previous day high was 7696.43 while the previous day low was 7570.6. The daily 38.2% Fib levels comes at 7618.67, expected to provide support. Similarly, the daily 61.8% fib level is at 7648.36, expected to provide resistance.
Note the levels of interest below:
- Pivot support is noted at 7545.02, 7494.89, 7419.19
- Pivot resistance is noted at 7670.85, 7746.55, 7796.68
| Levels | Levels.1 |
|---|---|
| Previous Daily High | 7696.43 |
| Previous Daily Low | 7570.60 |
| Previous Weekly High | 7746.31 |
| Previous Weekly Low | 7642.20 |
| Previous Monthly High | 7763.54 |
| Previous Monthly Low | 7460.39 |
| Daily Fibonacci 38.2% | 7618.67 |
| Daily Fibonacci 61.8% | 7648.36 |
| Daily Pivot Point S1 | 7545.02 |
| Daily Pivot Point S2 | 7494.89 |
| Daily Pivot Point S3 | 7419.19 |
| Daily Pivot Point R1 | 7670.85 |
| Daily Pivot Point R2 | 7746.55 |
| Daily Pivot Point R3 | 7796.68 |
[/s2If]
Nehcap Trading Strategies
The NEHCAP currently runs the following trading systems for clients. They can be bought and run on your funds.
The system is trading live: LIVE ACCOUNT TRACKING
Contact Us: Contact
The HFT_FIX can be run free for 2 weeks on any broker with a ECN. Apply for a free trial
Join Our Telegram Group
")


