#USDJPY @ 144.684 The is gravitating towards the 144.70 level with notable losses. (Pivot Orderbook analysis)
…
This is a premium post.
[s2If !current_user_can(access_s2member_level4)]Please register for FREE REGISTER to read full post below containing analysis. In case of any error or you think you are not able to read the full post below, please email us at support#nehcap.com [lwa][/s2If] [s2If current_user_can(access_s2member_level1)]
- The USD/JPY is gravitating towards the 144.70 level with notable losses.
- Soft PPI data for December weakened the US Dollar.
- Red Sea tensions may limit the downside for the pair.
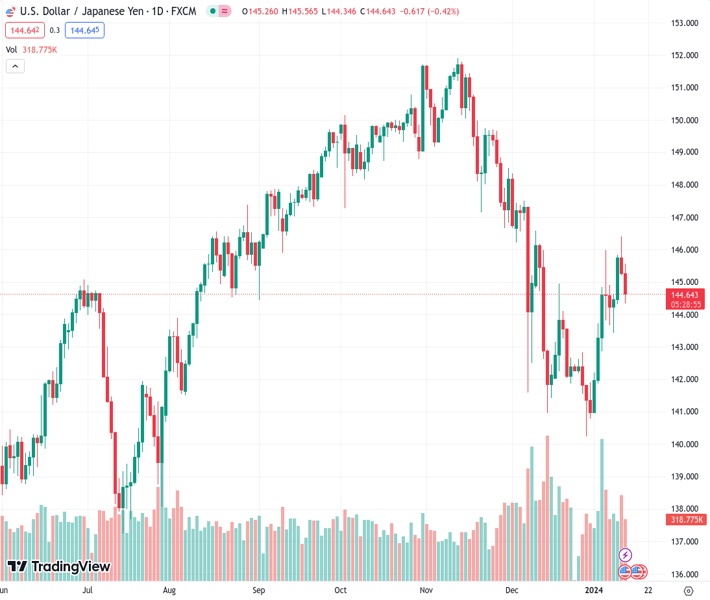
The pair currently trades last at 144.684.
The previous day high was 146.41 while the previous day low was 145.0. The daily 38.2% Fib levels comes at 145.54, expected to provide resistance. Similarly, the daily 61.8% fib level is at 145.88, expected to provide resistance.
In Friday’s trading session, USD/JPY encountered a setback, currently trading around 144.70 with losses of 0.40%. This downward movement is driven by the soft Producer Price Index (PPI), but escalating tensions in the Red Sea region may drive demand back to the US Dollar.
On the data front, the US Final Demand Producer Price Index (PPI) reported a 1% annual rise in December, a slight increase from November’s revised increase of 0.8%, according to Friday’s data from the Bureau of Labor Statistics. This reported percentage falls below the anticipated 1.3% market projection. The Core measure came in at 1.9%, lower than the 1.9% expected.
That being said, the US economy shows an upward trend in overall inflation, with the Consumer Price Index (CPI) rising from 3.1% to 3.4% annually, indicating the potential for higher interest rates if the Federal Reserve aims to control it, which may limit any US Dollar losses. Additionally, strong labor market conditions are suggested by lower weekly jobless claims, which may favor hawkish rhetoric from the bank.
Additionally, as tensions rise in the Red Sea between the US and Houthis rebels, markets fear potential escalation and may seek refuge in the Greenback, which could eventually push the pair upwards.
From the daily chart, the pair shows that the overall trend is bullish. This interpretation is drawn from the position of Simple Moving Averages (SMAs), where the pair is found below the 100-day SMA while staying above the 20-day and 200-day SMAs, implying that the buying strength continues to resist bearish pullback attempts.
Further, the Relative Strength Index (RSI) shows a negative dynamic, elaborating on the fact that the pair is in a negative territory. For now, it highlights that the potential bearish influences on the pair need to be watched, although the overall momentum could still see the bulls holding ground.
Additionally, the Moving Average Convergence Divergence (MACD) hints at a possible shift back towards bullish positions. Although green bars are decreasing, the fact they are still present suggests that the buying momentum, albeit slowing down, hasn’t entirely faded. Nevertheless, should these bars continue to decrease, it could signal an increase in the selling sentiment.
In summary, the technical landscape reflects neutral to slightly bearish conditions. Despite recent bearish movements, the buying sentiment still appears strong enough to challenge the selling momentum.
Technical Levels: Supports and Resistances
USDJPY currently trading at 144.71 at the time of writing. Pair opened at 145.4 and is trading with a change of -0.47 % .
| Overview | Overview.1 | |
|---|---|---|
| 0 | Today last price | 144.71 |
| 1 | Today Daily Change | -0.69 |
| 2 | Today Daily Change % | -0.47 |
| 3 | Today daily open | 145.40 |
The pair is trading above its 20 Daily moving average @ 143.1, below its 50 Daily moving average @ 146.21 , below its 100 Daily moving average @ 147.39 and above its 200 Daily moving average @ 143.57
| Trends | Trends.1 | |
|---|---|---|
| 0 | Daily SMA20 | 143.10 |
| 1 | Daily SMA50 | 146.21 |
| 2 | Daily SMA100 | 147.39 |
| 3 | Daily SMA200 | 143.57 |
The previous day high was 146.41 while the previous day low was 145.0. The daily 38.2% Fib levels comes at 145.54, expected to provide resistance. Similarly, the daily 61.8% fib level is at 145.88, expected to provide resistance.
Note the levels of interest below:
- Pivot support is noted at 144.8, 144.2, 143.39
- Pivot resistance is noted at 146.21, 147.02, 147.62
| Levels | Levels.1 |
|---|---|
| Previous Daily High | 146.41 |
| Previous Daily Low | 145.00 |
| Previous Weekly High | 145.98 |
| Previous Weekly Low | 140.81 |
| Previous Monthly High | 148.35 |
| Previous Monthly Low | 140.25 |
| Daily Fibonacci 38.2% | 145.54 |
| Daily Fibonacci 61.8% | 145.88 |
| Daily Pivot Point S1 | 144.80 |
| Daily Pivot Point S2 | 144.20 |
| Daily Pivot Point S3 | 143.39 |
| Daily Pivot Point R1 | 146.21 |
| Daily Pivot Point R2 | 147.02 |
| Daily Pivot Point R3 | 147.62 |
[/s2If]
Nehcap Trading Strategies
The NEHCAP currently runs the following trading systems for clients. They can be bought and run on your funds.
The system is trading live: LIVE ACCOUNT TRACKING
Contact Us: Contact
The HFT_FIX can be run free for 2 weeks on any broker with a ECN. Apply for a free trial
Join Our Telegram Group
")


