#NZDUSD @ 0.62557 intensifies on Chinese inflation and trade data. (Pivot Orderbook analysis)
…
This is a premium post.
[s2If !current_user_can(access_s2member_level4)]Please register for FREE REGISTER to read full post below containing analysis. In case of any error or you think you are not able to read the full post below, please email us at support#nehcap.com [lwa][/s2If] [s2If current_user_can(access_s2member_level1)]
- NZD/USD intensifies on Chinese inflation and trade data.
- Chinese CPI year-over-year fell by 0.3%. Meanwhile, the monthly figure eased to 0.1%.
- Chinese Trade Balance USD increased to $75.34B in December and the yearly Imports CNY rose by 1.6%.
- US CPI YoY and MoM rose by 3.4% and 0.3%, respectively, in December.
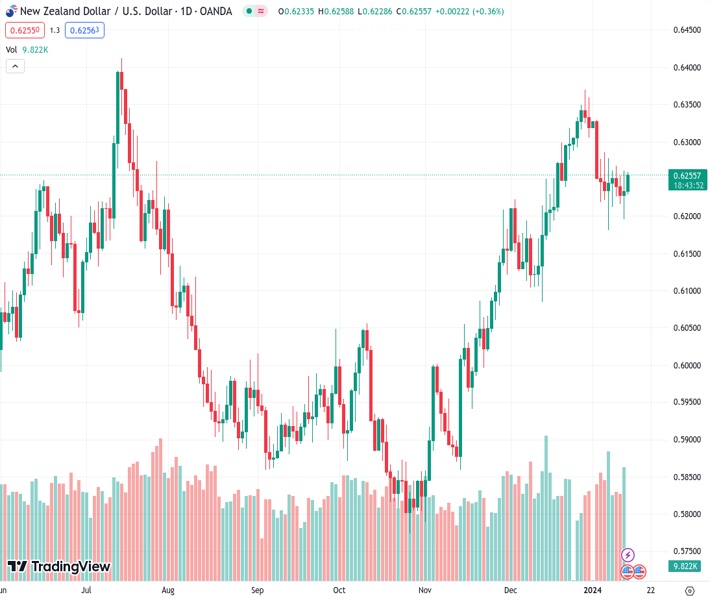
The pair currently trades last at 0.62557.
The previous day high was 0.626 while the previous day low was 0.6196. The daily 38.2% Fib levels comes at 0.6235, expected to provide support. Similarly, the daily 61.8% fib level is at 0.622, expected to provide support.
NZD/USD moves higher on an upward trajectory for the second consecutive session on Friday, improving near 0.6250 during the Asian session. The NZD/USD pair receives upward support on improved risk appetite as traders bet on speculation of Federal Reserve’s (Fed) rate cuts in March and May despite upbeat inflation data from the United States (US). Additionally, the moderate Chinese inflation data seems to reinforce the strength of the New Zealand Dollar (NZD), given the close trade ties between the two nations.
In December, the Chinese Consumer Price Index (YoY) showed a decrease of 0.3%, diverging from the anticipated 0.4% decline. The monthly Consumer Price Index displayed a more modest easing at 0.1%, compared to the market expectation of 0.2%. Meanwhile, the yearly Producer Price Index recorded a decline of 2.7%, slightly surpassing the expected decrease of 2.6%.
Additionally, the Chinese Trade Balance USD for December increased to $75.34B from $68.39B prior, exceeding the expected $74.75B. Exports (YoY) figure showed a growth of 2.3% against the 1.7% as expected. Meanwhile, the yearly Imports CNY increased by 1.6% from 0.6% prior. Traders further expect the release of the US Producer Price Index (PPI) data for December, seeking additional insights into the economic landscape of the United States (US).
The US Dollar Index (DXY) treaded water to build on recent gains in the early Asian hours on Friday following the positive US inflation data. However, the DXY trades slightly lower near 102.20, notwithstanding the improved US Treasury yields. The 2-year and 10-year yields on US bond coupons trades at 4.26% and 3.97%, respectively, by the press time.
Furthermore, the upbeat US inflation data helped the US Dollar to achieve some upward traction. US Consumer Price Index (CPI) rose by 3.4% YoY in December, exceeding both November’s 3.1% and the anticipated market figure of 3.2%. The monthly CPI growth for December showed a 0.3% increase, exceeding the market projection of 0.2%. The annual Core CPI eased to 3.9% from the previous reading of 4.0%, while the monthly figure remained consistent at 0.3%, in line with expectations.
Technical Levels: Supports and Resistances
NZDUSD currently trading at 0.6253 at the time of writing. Pair opened at 0.6232 and is trading with a change of 0.34 % .
| Overview | Overview.1 | |
|---|---|---|
| 0 | Today last price | 0.6253 |
| 1 | Today Daily Change | 0.0021 |
| 2 | Today Daily Change % | 0.3400 |
| 3 | Today daily open | 0.6232 |
The pair is trading below its 20 Daily moving average @ 0.6269, above its 50 Daily moving average @ 0.6145 , above its 100 Daily moving average @ 0.6029 and above its 200 Daily moving average @ 0.6092
| Trends | Trends.1 | |
|---|---|---|
| 0 | Daily SMA20 | 0.6269 |
| 1 | Daily SMA50 | 0.6145 |
| 2 | Daily SMA100 | 0.6029 |
| 3 | Daily SMA200 | 0.6092 |
The previous day high was 0.626 while the previous day low was 0.6196. The daily 38.2% Fib levels comes at 0.6235, expected to provide support. Similarly, the daily 61.8% fib level is at 0.622, expected to provide support.
Note the levels of interest below:
- Pivot support is noted at 0.6199, 0.6165, 0.6134
- Pivot resistance is noted at 0.6263, 0.6294, 0.6327
| Levels | Levels.1 |
|---|---|
| Previous Daily High | 0.6260 |
| Previous Daily Low | 0.6196 |
| Previous Weekly High | 0.6339 |
| Previous Weekly Low | 0.6181 |
| Previous Monthly High | 0.6410 |
| Previous Monthly Low | 0.6084 |
| Daily Fibonacci 38.2% | 0.6235 |
| Daily Fibonacci 61.8% | 0.6220 |
| Daily Pivot Point S1 | 0.6199 |
| Daily Pivot Point S2 | 0.6165 |
| Daily Pivot Point S3 | 0.6134 |
| Daily Pivot Point R1 | 0.6263 |
| Daily Pivot Point R2 | 0.6294 |
| Daily Pivot Point R3 | 0.6327 |
[/s2If]
Nehcap Trading Strategies
The NEHCAP currently runs the following trading systems for clients. They can be bought and run on your funds.
The system is trading live: LIVE ACCOUNT TRACKING
Contact Us: Contact
The HFT_FIX can be run free for 2 weeks on any broker with a ECN. Apply for a free trial
Join Our Telegram Group
")


