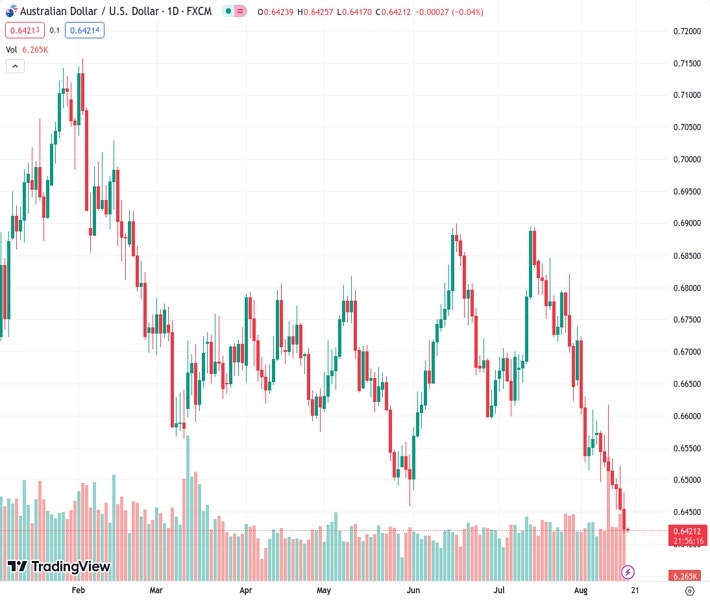
The Federal Reserve’s minutes indicate a strong dedication to maintaining a 2% inflation target for the AUDUSD exchange rate at 0.64221, as the majority of board members recognize the presence of ongoing inflation risks.
…
This is a premium post.
[s2If !current_user_can(access_s2member_level4)]Please register for FREE REGISTER to read full post below containing analysis. In case of any error or you think you are not able to read the full post below, please email us at support#nehcap.com [lwa][/s2If] [s2If current_user_can(access_s2member_level1)]
- Fed minutes reveal a commitment to the 2% inflation target, with most of the board acknowledging lingering inflation risks.
The pair currently trades last at 0.64221.
The previous day high was 0.6522 while the previous day low was 0.6452. The daily 38.2% Fib levels comes at 0.6478, expected to provide resistance. Similarly, the daily 61.8% fib level is at 0.6495, expected to provide resistance.
AUD/USD prolonged its losses on Wednesday after the US Federal Reserve (Fed) revealed its July meeting minutes, which bolstered the US Dollar (USD) as investors perceived a hawkish tilt in the minutes, as shown by money market futures. Consequently, the AUD/USD edges lower, with the pair trading at 0.6421, down 0.04% as the Asian session begins.
The minutes showcased the Fed’s board commitment to attain its 2% inflation target, with the majority of the board seeing risks of inflation lingering that could require action by the Fed. Even though officials elected to raise rates unanimously, cautious voices emerged, providing a dovish opinion and could pave the way for skipping a rate hike at the upcoming September meeting.
In regards to a recession, Fed staff no longers foresee a mild recession, though policymakers continued to stress downside risks to growth and upside risks to the unemployment rate. Federal Reserve officials agreed that forthcoming rate decisions would be based on a comprehensive assessment of incoming data while adopting a cautious approach in the upcoming months.
The market’s reaction to those plays saw an uptick in US Treasury bond yields, with the 10-year benchmark note yielding 4.258% gaining two basis points, underpinning the greenback, which according to the US Dollar Index (DXY), ended Wednesday’s session gaining 0.24% at 103.446.
On the Australian front, the release of July’s employment report on Thursday would be the week’s highlight. Labor market data is expected to show signs of weakness, which could ease pressure on the Reserve Bank of Australia (RBA), which, despite raising rates up to 4.10%, has paused its tightening cycle in the last two meetings.
Given the backdrop, the AUD/USD might continue to edge lower. It could be exacerbated by bad economic news from China, Australia’s largest trading partner. Recent data published by the National Bureau of Statistics (NBS) showed China’s economic recovery remains bumpy as domestic consumption remains soft, industrial production slowed down, and a deflationary scenario could dampen its economic growth.
The AUD/USD has fallen to new year-to-date (YTD) lows of 0.6415m threatening to extend its losses toward the 0.6400 figure. If that support gives way, the November 10 daily low of 0.6386 is up next before testing the November 2022 lows of 0.6272. Nevertheless, buyers keeping the AUD/USD pair above 0.6400 could pave the way for a recovery, with eyes set at 0.6500. A breach of the latter will expose a previous support-trendline turned resistance at 0.6525.
Technical Levels: Supports and Resistances
AUDUSD currently trading at 0.6426 at the time of writing. Pair opened at 0.6455 and is trading with a change of -0.45 % .
| Overview | Overview.1 | |
|---|---|---|
| 0 | Today last price | 0.6426 |
| 1 | Today Daily Change | -0.0029 |
| 2 | Today Daily Change % | -0.4500 |
| 3 | Today daily open | 0.6455 |
The pair remains strongly bearish on the daily time frame. It trades below the 20 SMA @ 0.6626, 50 SMA 0.6693, 100 SMA @ 0.6678 and 200 SMA @ 0.6737.
| Trends | Trends.1 | |
|---|---|---|
| 0 | Daily SMA20 | 0.6626 |
| 1 | Daily SMA50 | 0.6693 |
| 2 | Daily SMA100 | 0.6678 |
| 3 | Daily SMA200 | 0.6737 |
The previous day high was 0.6522 while the previous day low was 0.6452. The daily 38.2% Fib levels comes at 0.6478, expected to provide resistance. Similarly, the daily 61.8% fib level is at 0.6495, expected to provide resistance.
Note the levels of interest below:
- Pivot support is noted at 0.643, 0.6405, 0.6359
- Pivot resistance is noted at 0.6501, 0.6547, 0.6571
| Levels | Levels.1 |
|---|---|
| Previous Daily High | 0.6522 |
| Previous Daily Low | 0.6452 |
| Previous Weekly High | 0.6617 |
| Previous Weekly Low | 0.6486 |
| Previous Monthly High | 0.6895 |
| Previous Monthly Low | 0.6599 |
| Daily Fibonacci 38.2% | 0.6478 |
| Daily Fibonacci 61.8% | 0.6495 |
| Daily Pivot Point S1 | 0.6430 |
| Daily Pivot Point S2 | 0.6405 |
| Daily Pivot Point S3 | 0.6359 |
| Daily Pivot Point R1 | 0.6501 |
| Daily Pivot Point R2 | 0.6547 |
| Daily Pivot Point R3 | 0.6571 |
[/s2If]
Download Nehcap EAWe have two EAs that are operational on our LIVE accounts.
- EA-FIX: Check out the details here. Download EA-FIX . EA-FIX is a non-grid HFT scalper.
- EA-GROWTH: High quality low dd EA using trend grids. Download EA_GROWTHJoin Our Telegram Group


