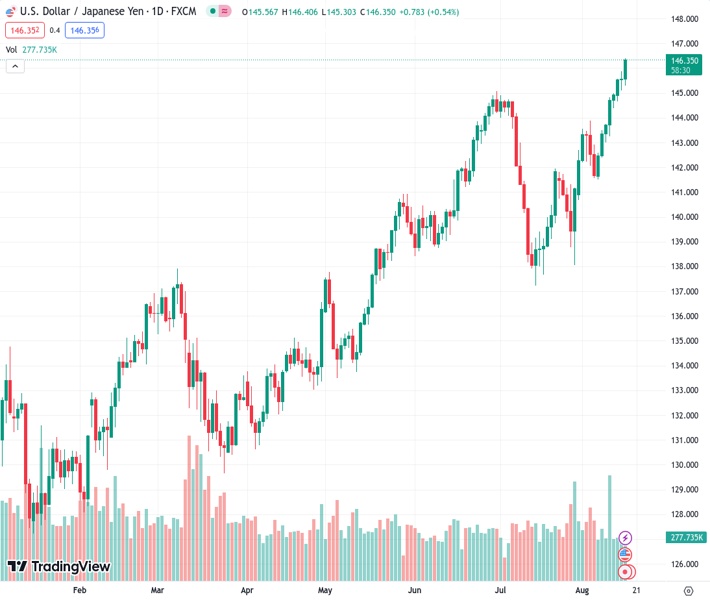
The USDJPY is currently trading close to 146.30, showing an increase of over 0.50% in its value for the day.
…
This is a premium post.
[s2If !current_user_can(access_s2member_level4)]Please register for FREE REGISTER to read full post below containing analysis. In case of any error or you think you are not able to read the full post below, please email us at support#nehcap.com [lwa][/s2If] [s2If current_user_can(access_s2member_level1)]
- USD/JPY trades near 146.30, seeing more than 0.50% gains on the day.
The pair currently trades last at 146.384.
The previous day high was 145.87 while the previous day low was 145.11. The daily 38.2% Fib levels comes at 145.58, expected to provide support. Similarly, the daily 61.8% fib level is at 145.4, expected to provide support.
On Wednesday, the USJ/JPY pair jumped above 146.00, showing more than 0.50% of daily gains and continues to trade in its highest levels in nine months. On the one hand, the Greenback strengthened on the back of investors placing hawkish bets on the Federal Reserve (Fed), after the release of the Minutes of the Federal Open Market Committee (FOMC) for the July meeting, which showed members considering another hike amid the upwards risks of inflation. On the Yen’s side, it continues to trade vulnerable against its rivals amid monetary policy divergences.
The FOMC published its minutes from the July meeting and revealed that participants still perceive inflationary pressure as quite high. In that sense, members referred to keeping the door open for more interest rate hikes if upcoming data shows robustness. On the other hand, some participants show a less aggressive stance favouring holding interest rates steady for the time being. That being said, it will all come down to the incoming data, just as Jerome Powell stated in its last press conference and the US economy is giving reasons for the FOMC members to be concerned with inflation remaining sticky as the rising economic activity and the hot labour market may eventually lead to more inflationary pressures.
In response to these developments, the US treasury yields for the 2-year, 5-year, and 10-year bonds are up, increasing between 0.50% and 1%, contributing to a 0.20% daily gain in the US dollar, as measured by the DXY index.
Analyzing the daily chart, it is evident that USD/JPY is bullish in the short term. Relative Strength Index (RSI) is comfortably settled above its midline in positive territory, exhibiting an upward trajectory. The presence of green bars on Moving Average Convergence Divergence (MACD) reinforces the growing bullish momentum. Furthermore, the pair is above the 20,100,200-day SMAs, implying that the bulls retain control on a broader scale. However, traders should be aware that indicators are near overbought conditions so a downward correction may be on the horizon.
Support levels: 145.00, 144.50, 144.00.
Resistance levels: 146.50, 147.00, 147.50.
Technical Levels: Supports and Resistances
USDJPY currently trading at 146.37 at the time of writing. Pair opened at 145.57 and is trading with a change of 0.55 % .
| Overview | Overview.1 | |
|---|---|---|
| 0 | Today last price | 146.37 |
| 1 | Today Daily Change | 0.80 |
| 2 | Today Daily Change % | 0.55 |
| 3 | Today daily open | 145.57 |
The pair remains strongly bullish on the daily timeframe. It trades above its 20 SMA @ 142.43, 50 SMA 141.94, 100 SMA @ 138.79 and 200 SMA @ 136.47.
| Trends | Trends.1 | |
|---|---|---|
| 0 | Daily SMA20 | 142.43 |
| 1 | Daily SMA50 | 141.94 |
| 2 | Daily SMA100 | 138.79 |
| 3 | Daily SMA200 | 136.47 |
The previous day high was 145.87 while the previous day low was 145.11. The daily 38.2% Fib levels comes at 145.58, expected to provide support. Similarly, the daily 61.8% fib level is at 145.4, expected to provide support.
Note the levels of interest below:
- Pivot support is noted at 145.16, 144.75, 144.4
- Pivot resistance is noted at 145.92, 146.27, 146.68
| Levels | Levels.1 |
|---|---|
| Previous Daily High | 145.87 |
| Previous Daily Low | 145.11 |
| Previous Weekly High | 145.00 |
| Previous Weekly Low | 141.51 |
| Previous Monthly High | 144.91 |
| Previous Monthly Low | 137.24 |
| Daily Fibonacci 38.2% | 145.58 |
| Daily Fibonacci 61.8% | 145.40 |
| Daily Pivot Point S1 | 145.16 |
| Daily Pivot Point S2 | 144.75 |
| Daily Pivot Point S3 | 144.40 |
| Daily Pivot Point R1 | 145.92 |
| Daily Pivot Point R2 | 146.27 |
| Daily Pivot Point R3 | 146.68 |
[/s2If]
Download Nehcap EAWe have two EAs that are operational on our LIVE accounts.
- EA-FIX: Check out the details here. Download EA-FIX . EA-FIX is a non-grid HFT scalper.
- EA-GROWTH: High quality low dd EA using trend grids. Download EA_GROWTHJoin Our Telegram Group


