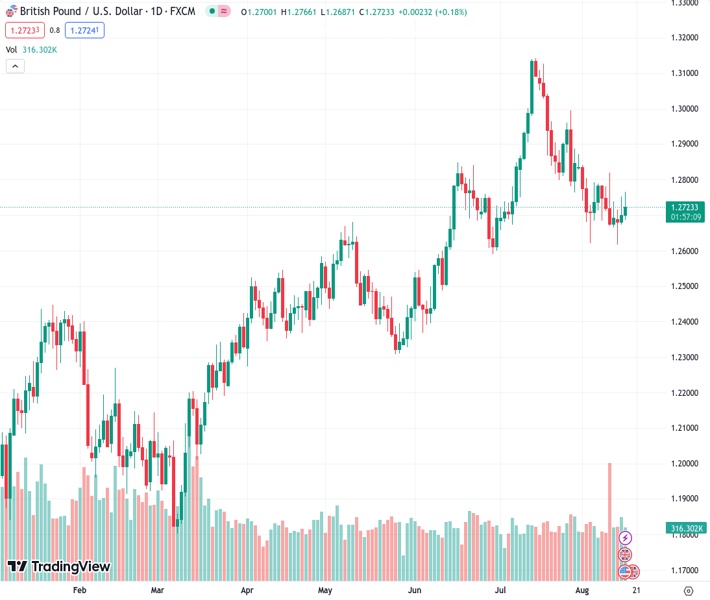
The GBPUSD pair is currently trading at approximately 1.2740, close to its earlier peak of 1.2766 during the session.
…
This is a premium post.
[s2If !current_user_can(access_s2member_level4)]Please register for FREE REGISTER to read full post below containing analysis. In case of any error or you think you are not able to read the full post below, please email us at support#nehcap.com [lwa][/s2If] [s2If current_user_can(access_s2member_level1)]
- GBP/USD trades near 1.2740, after hitting a daily high of 1.2766 previously in the session.
The pair currently trades last at 1.27244.
The previous day high was 1.2752 while the previous day low was 1.2675. The daily 38.2% Fib levels comes at 1.2723, expected to provide support. Similarly, the daily 61.8% fib level is at 1.2705, expected to provide support.
After the release of July’s Federal Open Market Committee (FOMC) minutes, the GBP/USD saw little change. Despite members sounding hawkish, if failed to trigger a significant reaction on the USD, the GBP continues to trade strong amid hot inflation figures from the UK and hawkish bets on the Bank of England.
Minutes showed that members were concerned with the upside inflation risks due to a hot labour market and left the door open for another hike, at least for this cycle. The immediate reaction was a slightly upwards movement of the US DXY index and the US Treasury bond yields, but the GBP/USD held its ground.
It will all come down to incoming data. Overall the US economy shows strong economic activity and a robust labour market while inflation retreats. Before the September meeting, the Federal Reserve (Fed) will receive an additional Nonfarm Payrroll and Consumer Price Index (CPI) report and medium-tier economic activity figures from August. As for now, according to the CME FedWatch tool, markets bet that the Fed will pause in September and foresee 40% odds of a 25 basis points hike in November.
According to the daily chart, the technical outlook for the GBP/USD remains neutral to bullish as the bulls are recovering ground. With an ascending slope below its midline, the Relative Strength Index (RSI) suggests a potential increase in buying pressure, while the Moving Average Convergence (MACD) exhibits lower red bars. On the other hand, the pair is above the 20-day Simple Moving Average (SMA), below the 100-day SMA, but above the 200-day SMA, indicating that the bulls still have the upper hand looking at the broader picture.
Support levels: 1.2730, 1.2715, 1.2700.
Resistance levels: 1.2760, 1.2780, 1.2800.
Technical Levels: Supports and Resistances
GBPUSD currently trading at 1.2731 at the time of writing. Pair opened at 1.2704 and is trading with a change of 0.21 % .
| Overview | Overview.1 | |
|---|---|---|
| 0 | Today last price | 1.2731 |
| 1 | Today Daily Change | 0.0027 |
| 2 | Today Daily Change % | 0.2100 |
| 3 | Today daily open | 1.2704 |
The pair is trading below its 20 Daily moving average @ 1.2789, below its 50 Daily moving average @ 1.2775 , above its 100 Daily moving average @ 1.2616 and above its 200 Daily moving average @ 1.2362
| Trends | Trends.1 | |
|---|---|---|
| 0 | Daily SMA20 | 1.2789 |
| 1 | Daily SMA50 | 1.2775 |
| 2 | Daily SMA100 | 1.2616 |
| 3 | Daily SMA200 | 1.2362 |
The previous day high was 1.2752 while the previous day low was 1.2675. The daily 38.2% Fib levels comes at 1.2723, expected to provide support. Similarly, the daily 61.8% fib level is at 1.2705, expected to provide support.
Note the levels of interest below:
- Pivot support is noted at 1.2669, 1.2634, 1.2592
- Pivot resistance is noted at 1.2746, 1.2788, 1.2823
| Levels | Levels.1 |
|---|---|
| Previous Daily High | 1.2752 |
| Previous Daily Low | 1.2675 |
| Previous Weekly High | 1.2819 |
| Previous Weekly Low | 1.2666 |
| Previous Monthly High | 1.3142 |
| Previous Monthly Low | 1.2659 |
| Daily Fibonacci 38.2% | 1.2723 |
| Daily Fibonacci 61.8% | 1.2705 |
| Daily Pivot Point S1 | 1.2669 |
| Daily Pivot Point S2 | 1.2634 |
| Daily Pivot Point S3 | 1.2592 |
| Daily Pivot Point R1 | 1.2746 |
| Daily Pivot Point R2 | 1.2788 |
| Daily Pivot Point R3 | 1.2823 |
[/s2If]
Download Nehcap EAWe have two EAs that are operational on our LIVE accounts.
- EA-FIX: Check out the details here. Download EA-FIX . EA-FIX is a non-grid HFT scalper.
- EA-GROWTH: High quality low dd EA using trend grids. Download EA_GROWTHJoin Our Telegram Group


