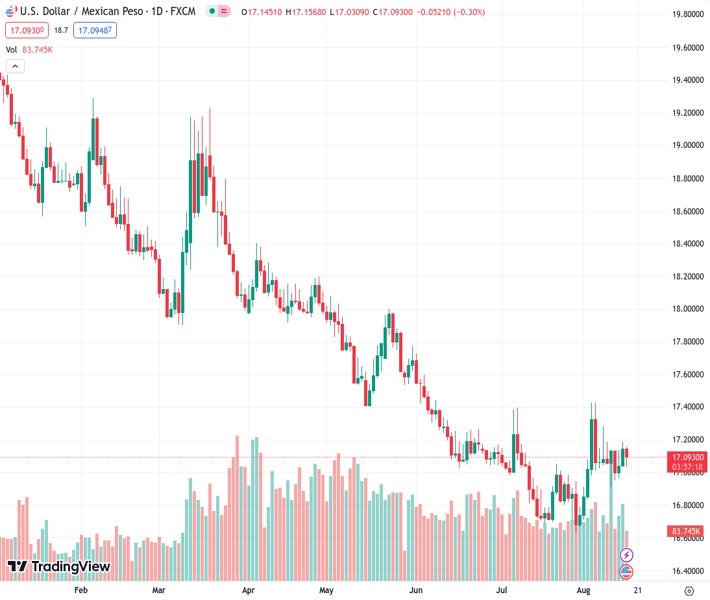
The US dollar to Mexican peso exchange rate is at 17.0931. Housing Starts data for the month of July suggests a favorable trend in the housing market, indicating a stable situation after the Federal Reserve’s tightening measures.
…
This is a premium post.
[s2If !current_user_can(access_s2member_level4)]Please register for FREE REGISTER to read full post below containing analysis. In case of any error or you think you are not able to read the full post below, please email us at support#nehcap.com [lwa][/s2If] [s2If current_user_can(access_s2member_level1)]
- US Housing Starts for July show positive momentum, indicating stabilization in the housing market post-Fed tightening.
The pair currently trades last at 17.0931.
The previous day high was 17.1888 while the previous day low was 17.0388. The daily 38.2% Fib levels comes at 17.1315, expected to provide resistance. Similarly, the daily 61.8% fib level is at 17.0961, expected to provide resistance.
USD/MXN trims some of its Tuesday’s losses amid overall US Dollar (USD) weakness across the FX board, as data from the United States was mixed, while traders brace for the release of the latest US Federal Reserve (Fed) meeting minutes. Hence, the USD/MXN is trading at 17.0697 after hitting a daily high of 17.1568.
A risk-off impulse was not an excuse for the Mexican Peso (MXN) to appreciate further. US data revealed by the US Census Bureau showed the housing market continues to stabilize amidst 525 basis points of tightening by the Fed. Housing Starts for July rose by 3.9% MoM at a rate of 1.452 million exceeding June’s -11.7% plunge, which was downward revised from -8%. Further data showed that Building Permits climbed 0.1% in July, exceeding June -3.7% plunge.
Although the data was positive, the USD/MXN had a muted reaction. The Fed revealed that Industrial Production in the US grew 1% in July in month-over-months (MoM) figures, exceeding June’s drop, while annually based, plummeted -0.2%.
Aside from this, investors are flocking to the Greenback, which has shifted upwards, gaining 0.12%, as shown by the US Dollar Index (DXY) standing at 103.321, influenced by US Treasury bond yields resuming their uptrend.
Traders’ focus shifts towards the release of the latest Fed meeting minutes. Investors are looking for clear signs that could reassure the Fed’s tightening cycle has ended. The latest Fed speeches have shown that officials are turning neutral, as previous hawks members like Atlanta Fed President Raphael Bostic and Philadelphia Fed President Patrick Harker said no more increases were needed.
The daily chart portrays the USD/MXN consolidated within 17.0000/17.150000, unable to break above or below the range decisively. The lack of economic data from Mexico, and the interest rate differential, keeps the pair from rallying sharply. Nevertheless, it should be said that the daily Moving Averages (DMAs) are closing into the spot price, putting at risk the previous downtrend. If USD/MXN breaches the top of the range, the next stop would be the 100-DMA at 17.4525 before challenging the psychological 18.00 figure. If USD/MXN sellers reclaim 17.0000, a re-test of the year-to-date (YTD) low of 16.6238 is on the cards.
Technical Levels: Supports and Resistances
USDMXN currently trading at 17.0694 at the time of writing. Pair opened at 17.1479 and is trading with a change of -0.46 % .
| Overview | Overview.1 | |
|---|---|---|
| 0 | Today last price | 17.0694 |
| 1 | Today Daily Change | -0.0785 |
| 2 | Today Daily Change % | -0.4600 |
| 3 | Today daily open | 17.1479 |
The pair is trading above its 20 Daily moving average @ 16.9706, above its 50 Daily moving average @ 17.0429 , below its 100 Daily moving average @ 17.4596 and below its 200 Daily moving average @ 18.2262
| Trends | Trends.1 | |
|---|---|---|
| 0 | Daily SMA20 | 16.9706 |
| 1 | Daily SMA50 | 17.0429 |
| 2 | Daily SMA100 | 17.4596 |
| 3 | Daily SMA200 | 18.2262 |
The previous day high was 17.1888 while the previous day low was 17.0388. The daily 38.2% Fib levels comes at 17.1315, expected to provide resistance. Similarly, the daily 61.8% fib level is at 17.0961, expected to provide resistance.
Note the levels of interest below:
- Pivot support is noted at 17.0615, 16.9751, 16.9114
- Pivot resistance is noted at 17.2116, 17.2752, 17.3616
| Levels | Levels.1 |
|---|---|
| Previous Daily High | 17.1888 |
| Previous Daily Low | 17.0388 |
| Previous Weekly High | 17.2852 |
| Previous Weekly Low | 16.9101 |
| Previous Monthly High | 17.3957 |
| Previous Monthly Low | 16.6258 |
| Daily Fibonacci 38.2% | 17.1315 |
| Daily Fibonacci 61.8% | 17.0961 |
| Daily Pivot Point S1 | 17.0615 |
| Daily Pivot Point S2 | 16.9751 |
| Daily Pivot Point S3 | 16.9114 |
| Daily Pivot Point R1 | 17.2116 |
| Daily Pivot Point R2 | 17.2752 |
| Daily Pivot Point R3 | 17.3616 |
[/s2If]
Download Nehcap EAWe have two EAs that are operational on our LIVE accounts.
- EA-FIX: Check out the details here. Download EA-FIX . EA-FIX is a non-grid HFT scalper.
- EA-GROWTH: High quality low dd EA using trend grids. Download EA_GROWTHJoin Our Telegram Group


