The US housing market experienced a revival in July as indicated by the USDJPY rate of 145.814. Nevertheless, there is a possibility that the sector’s recovery could be impeded by the increasing mortgage rates.
…
This is a premium post.
[s2If !current_user_can(access_s2member_level4)]Please register for FREE REGISTER to read full post below containing analysis. In case of any error or you think you are not able to read the full post below, please email us at support#nehcap.com [lwa][/s2If] [s2If current_user_can(access_s2member_level1)]
- US housing starts rebound in July, though rising mortgage rates may hinder sector recovery.
The pair currently trades last at 145.814.
The previous day high was 145.87 while the previous day low was 145.11. The daily 38.2% Fib levels comes at 145.58, expected to provide support. Similarly, the daily 61.8% fib level is at 145.4, expected to provide support.
USD/JPY aims higher but remains trading within a narrow range as threats of a possible intervention by Japanese authorities loom. Housing data from the United States (US) shows the construction sector stabilizing after the US Federal Reserve (Fed) lifted rates aggressively, dampening house demand. The USD/JPY is exchanging hands at 145.85 after hitting a daily low of 145.30.
The US Census Bureau revealed that housing starts jumped at a 3.9% rate of 1.452 million in July, crashing June’s -11.7% plunge, which was downward revised from -8%. Although data is encouraging, higher mortgage rates for 30-year hitting 6.96% over the last week, can curtail the sector’s recovery. At the same time, Building Permits rose 0.1% in July, above June’s -3.7% slide.
Even though the data was positive, the Greenback failed to gain traction as expected, as shown by the US Dollar Index (DXY) losing 0.02% at 103.187. Consequently, the USD/JPY uptrend was capped at spot price, as the US 10-year Treasury bond yield is unchanged at 4.211%.
On the Japanese front, the latest Gross Domestic Product (GDP) report for Q2 2023 smashed estimates of 3.1%, with the economy growing at an outstanding 6%, doubling forecasts, as reported on August 14. Furthermore, as reported by the Reuters Tankan Index, business activity shows an improvement from July’s 3 reading to 12 in August. Although the report was positive, many firms remain cautious about the economic outlook, as slowing growth in China could dent demand for Japanese products. Traders should be aware that China is Japan’s largest partner.
Given the backdrop, the USD/JPY trades sideways, as the US and Japan have posted solid data. Though, expectations for monetary policy normalization of the Bank of Japan (BoJ) could favor the Japanese Yen (JPY) in the medium term. In the meantime, further USD/JPY upside is expected, but intervention jitters could cap the pair’s uptrend.
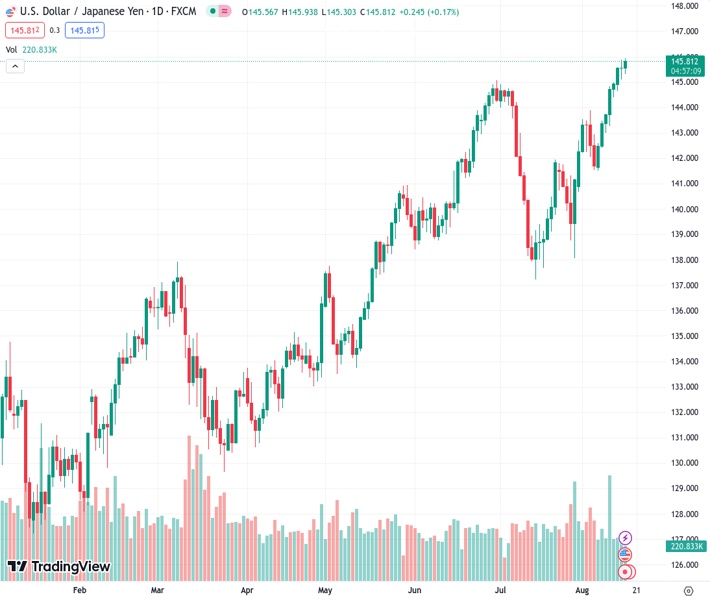
The USD/JPY daily chart portrays the pair peaking around current exchange rates after hitting a year-to-date (YTD) high of 145.94, shy of the 146.00 figure. A breach of the latter will expose higher resistance levels above the 146.00 mark, like the November 10 daily high at 146.59, followed by the November 8 high of 146.94, before reaching 147.00. Conversely, the USD/JPY first support would be today’s low of 145.30, followed by the August 15 low of 145.10, before sliding to the 145.00 figure.
Technical Levels: Supports and Resistances
USDJPY currently trading at 145.77 at the time of writing. Pair opened at 145.57 and is trading with a change of 0.14 % .
| Overview | Overview.1 | |
|---|---|---|
| 0 | Today last price | 145.77 |
| 1 | Today Daily Change | 0.20 |
| 2 | Today Daily Change % | 0.14 |
| 3 | Today daily open | 145.57 |
The pair remains strongly bullish on the daily timeframe. It trades above its 20 SMA @ 142.43, 50 SMA 141.94, 100 SMA @ 138.79 and 200 SMA @ 136.47.
| Trends | Trends.1 | |
|---|---|---|
| 0 | Daily SMA20 | 142.43 |
| 1 | Daily SMA50 | 141.94 |
| 2 | Daily SMA100 | 138.79 |
| 3 | Daily SMA200 | 136.47 |
The previous day high was 145.87 while the previous day low was 145.11. The daily 38.2% Fib levels comes at 145.58, expected to provide support. Similarly, the daily 61.8% fib level is at 145.4, expected to provide support.
Note the levels of interest below:
- Pivot support is noted at 145.16, 144.75, 144.4
- Pivot resistance is noted at 145.92, 146.27, 146.68
| Levels | Levels.1 |
|---|---|
| Previous Daily High | 145.87 |
| Previous Daily Low | 145.11 |
| Previous Weekly High | 145.00 |
| Previous Weekly Low | 141.51 |
| Previous Monthly High | 144.91 |
| Previous Monthly Low | 137.24 |
| Daily Fibonacci 38.2% | 145.58 |
| Daily Fibonacci 61.8% | 145.40 |
| Daily Pivot Point S1 | 145.16 |
| Daily Pivot Point S2 | 144.75 |
| Daily Pivot Point S3 | 144.40 |
| Daily Pivot Point R1 | 145.92 |
| Daily Pivot Point R2 | 146.27 |
| Daily Pivot Point R3 | 146.68 |
[/s2If]
Download Nehcap EAWe have two EAs that are operational on our LIVE accounts.
- EA-FIX: Check out the details here. Download EA-FIX . EA-FIX is a non-grid HFT scalper.
- EA-GROWTH: High quality low dd EA using trend grids. Download EA_GROWTHJoin Our Telegram Group


