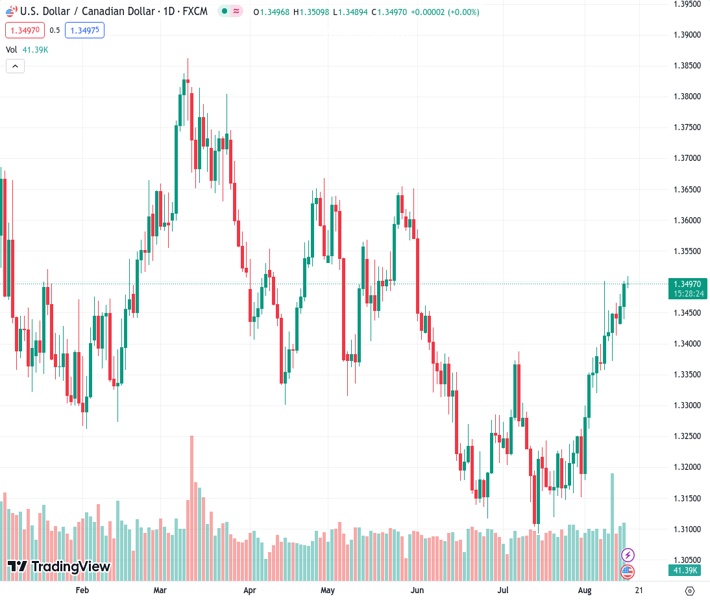
The USDCAD currency pair, currently trading at 1.34989, remains stable at its highest level in eleven weeks as the market approaches a major event for the week with a sense of caution.
…
This is a premium post.
[s2If !current_user_can(access_s2member_level4)]Please register for FREE REGISTER to read full post below containing analysis. In case of any error or you think you are not able to read the full post below, please email us at support#nehcap.com [lwa][/s2If] [s2If current_user_can(access_s2member_level1)]
- USD/CAD steadies at 11-week high amid market’s cautious mood ahead of week’s top-tier event.
The pair currently trades last at 1.34989.
The previous day high was 1.3502 while the previous day low was 1.3439. The daily 38.2% Fib levels comes at 1.3478, expected to provide support. Similarly, the daily 61.8% fib level is at 1.3463, expected to provide support.
USD/CAD bulls take a breather at the highest level since early June, keeping the reins around 1.3500 heading into Wednesday’s European session. In doing so, the Loonie pair struggles between the contrasting catalysts, namely the US Dollar’s retreat and the WTI crude oil’s downbeat performance, amid the cautious mood ahead of today’s Federal Open Market Committee’s (FOMC) latest Monetary Policy Meeting Minutes.
It’s worth noting that the previous day’s upbeat prints of the Canada Consumer Price Index (CPI) and the Bank of Canada (BoC) CPI failed to impress the Canadian Dollar (CAD) buyers as the risk-off mood joined strong US Retail Sales. Further, hawkish comments from Minneapolis Federal Reserve President Neel Kashkari also add strength to the bullish bias about the Loonie pair.
That said, the WTI crude oil drops half a percent to $80.25 by the press time as energy bears prod the one-week low marked the previous day amid fears of receding demand from China, one of the world’s biggest oil customers.
On the other hand, the US Dollar Index (DXY) seesaws around 103.20 while poking a five-month-old descending resistance line at the highest level in a month. In doing so, the Greenback’s gauge versus the six major currencies prints the first daily loss, so far, in five.
Additionally, a pullback in the benchmark US 10-year Treasury bond yields from the yearly high joins a pause in the downside of the US stock futures and mixed performance of the Asia-Pacific shares to portray the market’s cautious optimism, which in turn prods the USD/CAD traders.
Looking ahead, Canada Housing Starts and Wholesale Sales for July and June will precede the US Industrial Production for July to offer intermediate entertainment to the USD/CAD pair. However, major attention will be given to the Fed Minutes as market players anticipate an end of the hawkish cycle at the US central bank, which if confirmed could drag the Loonie pair from a multi-day high.
A daily closing beyond the convergence of a five-month-old descending trend line and the 200-DMA, around 1.3450 by the press time, keeps USD/CAD buyers hopeful amid bullish MACD signals.
Technical Levels: Supports and Resistances
USDCAD currently trading at 1.3501 at the time of writing. Pair opened at 1.3498 and is trading with a change of 0.02% % .
| Overview | Overview.1 | |
|---|---|---|
| 0 | Today last price | 1.3501 |
| 1 | Today Daily Change | 0.0003 |
| 2 | Today Daily Change % | 0.02% |
| 3 | Today daily open | 1.3498 |
The pair remains strongly bullish on the daily timeframe. It trades above its 20 SMA @ 1.331, 50 SMA 1.3271, 100 SMA @ 1.3384 and 200 SMA @ 1.3451.
| Trends | Trends.1 | |
|---|---|---|
| 0 | Daily SMA20 | 1.3310 |
| 1 | Daily SMA50 | 1.3271 |
| 2 | Daily SMA100 | 1.3384 |
| 3 | Daily SMA200 | 1.3451 |
The previous day high was 1.3502 while the previous day low was 1.3439. The daily 38.2% Fib levels comes at 1.3478, expected to provide support. Similarly, the daily 61.8% fib level is at 1.3463, expected to provide support.
Note the levels of interest below:
- Pivot support is noted at 1.3457, 1.3417, 1.3395
- Pivot resistance is noted at 1.352, 1.3542, 1.3582
| Levels | Levels.1 |
|---|---|
| Previous Daily High | 1.3502 |
| Previous Daily Low | 1.3439 |
| Previous Weekly High | 1.3502 |
| Previous Weekly Low | 1.3356 |
| Previous Monthly High | 1.3387 |
| Previous Monthly Low | 1.3093 |
| Daily Fibonacci 38.2% | 1.3478 |
| Daily Fibonacci 61.8% | 1.3463 |
| Daily Pivot Point S1 | 1.3457 |
| Daily Pivot Point S2 | 1.3417 |
| Daily Pivot Point S3 | 1.3395 |
| Daily Pivot Point R1 | 1.3520 |
| Daily Pivot Point R2 | 1.3542 |
| Daily Pivot Point R3 | 1.3582 |
[/s2If]
Download Nehcap EAWe have two EAs that are operational on our LIVE accounts.
- EA-FIX: Check out the details here. Download EA-FIX . EA-FIX is a non-grid HFT scalper.
- EA-GROWTH: High quality low dd EA using trend grids. Download EA_GROWTHJoin Our Telegram Group


