The USDJPY currency pair is currently fluctuating within a small margin around 145.52, exhibiting a slight decrease of 0.02% over the day.
…
This is a premium post.
[s2If !current_user_can(access_s2member_level4)]Please register for FREE REGISTER to read full post below containing analysis. In case of any error or you think you are not able to read the full post below, please email us at support#nehcap.com [lwa][/s2If] [s2If current_user_can(access_s2member_level1)]
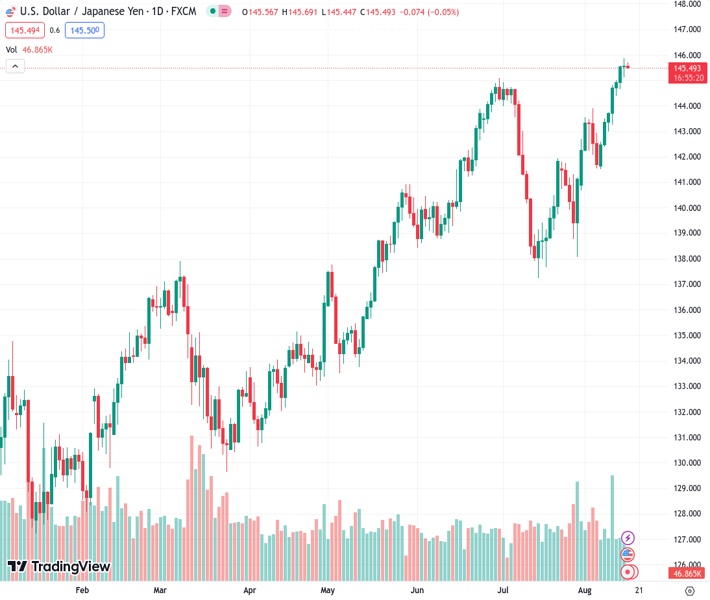
- USD/JPY oscillates in a narrow range around 145.52, down 0.02% for the day.
The pair currently trades last at 145.495.
The previous day high was 145.87 while the previous day low was 145.11. The daily 38.2% Fib levels comes at 145.58, expected to provide resistance. Similarly, the daily 61.8% fib level is at 145.4, expected to provide support.
The USD/JPY pair remains confined around the 145.45–70 region in a narrow trading band in the Asian session on Wednesday. Traders continue to fear intervention by the Bank of Japan (BoJ) as the JPY weakens to a 9-month low. The major currently trades near 145.52, losing 0.02% for the day.
According to the preliminary data of the Gross Domestic Product (GDP) figures for the second quarter (Q2) of 2023 on Tuesday, Japan’s economic growth came in at 1.5% QoQ, versus 0.8% expected and 0.7% previously. Meanwhile, the annualised GDP increased to 6.0%, compared to 3.1% estimated and 2.7% previously. Japan’s Economy Minister Shigeyuki Goto stated that he anticipated a moderate economic recovery before mentioning the need to pay attention to the danger of a global downturn and the impacts of price increases. Goto demonstrated a willingness to respond flexibly to the economy and prices as needed.
That said, the monetary policy differential between the US and Japan is the main driver of the Yen’s weakening. However, the optimism that US interest rates have peaked might cap the upside in the Greenback. Furthermore, traders turn cautious amid the fear of FX intervention by the BoJ. It’s worth noting that the Japanese central bank prompted massive dollar selling in September and October last year as the Japanese Yen approached the 145 zone.
Finance Minister Shunichi Suzuki stated on Tuesday that rapid movements are “undesirable” and the government is “ready to respond appropriately,” while emphasising that no particular levels are intended for intervention, per Reuters.
Across the pond, US Retail Sales came in above expectations. The headline figure climbed by 0.7% MoM, higher than the 0.4% estimated. Sales excluding the automobile sector came in at 1%, versus the expected 0.4%. Meanwhile, the NY Empire Manufacturing Index fell to -19 from -1. On Tuesday, Minnesota’s Federal Reserve (Fed) President Neil Kashkari stated that he is pleased with the progress on inflation, but it is still too high. Kashkari noted the uncertainty regarding whether the Fed has done enough or needs to do more.
Market players will take more cues from the economic data. Later in the day, the US Building Permits, Housing Starts, and Industrial Production will be released. However, the FOMC minutes will be the key event this week. On the Japanese docket, the nation’s Trade data and annual National Consumer Price Index for July will be due on Thursday and Friday, respectively.
Technical Levels: Supports and Resistances
USDJPY currently trading at 145.53 at the time of writing. Pair opened at 145.57 and is trading with a change of -0.03 % .
| Overview | Overview.1 | |
|---|---|---|
| 0 | Today last price | 145.53 |
| 1 | Today Daily Change | -0.04 |
| 2 | Today Daily Change % | -0.03 |
| 3 | Today daily open | 145.57 |
The pair remains strongly bullish on the daily timeframe. It trades above its 20 SMA @ 142.43, 50 SMA 141.94, 100 SMA @ 138.79 and 200 SMA @ 136.47.
| Trends | Trends.1 | |
|---|---|---|
| 0 | Daily SMA20 | 142.43 |
| 1 | Daily SMA50 | 141.94 |
| 2 | Daily SMA100 | 138.79 |
| 3 | Daily SMA200 | 136.47 |
The previous day high was 145.87 while the previous day low was 145.11. The daily 38.2% Fib levels comes at 145.58, expected to provide resistance. Similarly, the daily 61.8% fib level is at 145.4, expected to provide support.
Note the levels of interest below:
- Pivot support is noted at 145.16, 144.75, 144.4
- Pivot resistance is noted at 145.92, 146.27, 146.68
| Levels | Levels.1 |
|---|---|
| Previous Daily High | 145.87 |
| Previous Daily Low | 145.11 |
| Previous Weekly High | 145.00 |
| Previous Weekly Low | 141.51 |
| Previous Monthly High | 144.91 |
| Previous Monthly Low | 137.24 |
| Daily Fibonacci 38.2% | 145.58 |
| Daily Fibonacci 61.8% | 145.40 |
| Daily Pivot Point S1 | 145.16 |
| Daily Pivot Point S2 | 144.75 |
| Daily Pivot Point S3 | 144.40 |
| Daily Pivot Point R1 | 145.92 |
| Daily Pivot Point R2 | 146.27 |
| Daily Pivot Point R3 | 146.68 |
[/s2If]
Download Nehcap EAWe have two EAs that are operational on our LIVE accounts.
- EA-FIX: Check out the details here. Download EA-FIX . EA-FIX is a non-grid HFT scalper.
- EA-GROWTH: High quality low dd EA using trend grids. Download EA_GROWTHJoin Our Telegram Group


