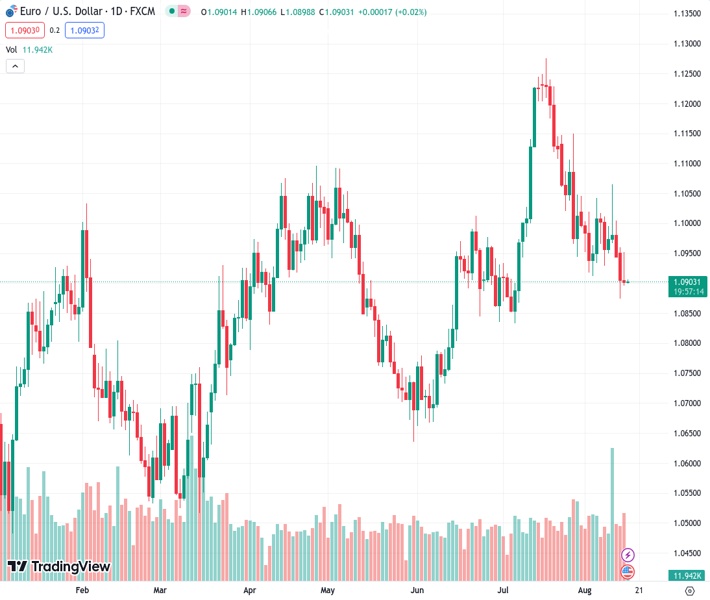
The EURUSD pair, currently trading at 1.09031, continues to stay at a low level following a lack of success in deterring sellers the day before. According to the viewpoint of @nehcap, it is anticipated that there will be further declines in the future.
…
This is a premium post.
[s2If !current_user_can(access_s2member_level4)]Please register for FREE REGISTER to read full post below containing analysis. In case of any error or you think you are not able to read the full post below, please email us at support#nehcap.com [lwa][/s2If] [s2If current_user_can(access_s2member_level1)]
- EUR/USD remains depressed around intraday low after failing to stop sellers the previous day.
The pair currently trades last at 1.09031.
The previous day high was 1.0952 while the previous day low was 1.0897. The daily 38.2% Fib levels comes at 1.0931, expected to provide resistance. Similarly, the daily 61.8% fib level is at 1.0918, expected to provide resistance.
EUR/USD holds lower grounds near 1.0900, poking the intraday bottom amid early Wednesday in Asia. In doing so, the Euro pair struggles for clear directions amid the cautious mood ahead of the Federal Open Market Committee’s (FOMC) Monetary Policy Meeting Minutes. Also likely to challenge the Euro bears is the Doji candlestick marked the previous day, as well as the nearly oversold RSI (14) line. As a result, the Euro bears need a strong hawkish tone from the Fed Minutes to defend the one-month-old downside trend.
Also read: EUR/USD Forecast: Continued bearish pressure persists amid Dollar strength
It’s worth noting that the bearish MACD signals and the quote’s sustained trading below the 100-DMA, as well as a one-month-old falling trend line, joins the early month’s downside break of an ascending trend line from late May to keep the EUR/USD sellers hopeful.
That said, a seven-week-old horizontal support region around 1.0845–35 restricts immediate downside of the EUR/USD pair, a break of which will direct the south-run towards the 200-DMA support of 1.0785.
On the flip side, a convergence of the 100-DMA and a downward-sloping trend line from July 19 guards the EUR/USD pair’s recovery around 1.0930-35 zone.
Following that, the support-turned-resistance line of around 1.1095 and the 1.1100 round figure will lure the EUR/USD bulls.
Trend: Further downside expected
Technical Levels: Supports and Resistances
EURUSD currently trading at 1.0903 at the time of writing. Pair opened at 1.0907 and is trading with a change of -0.04% % .
| Overview | Overview.1 | |
|---|---|---|
| 0 | Today last price | 1.0903 |
| 1 | Today Daily Change | -0.0004 |
| 2 | Today Daily Change % | -0.04% |
| 3 | Today daily open | 1.0907 |
The pair is trading below its 20 Daily moving average @ 1.101, below its 50 Daily moving average @ 1.097 , below its 100 Daily moving average @ 1.0931 and above its 200 Daily moving average @ 1.0781
| Trends | Trends.1 | |
|---|---|---|
| 0 | Daily SMA20 | 1.1010 |
| 1 | Daily SMA50 | 1.0970 |
| 2 | Daily SMA100 | 1.0931 |
| 3 | Daily SMA200 | 1.0781 |
The previous day high was 1.0952 while the previous day low was 1.0897. The daily 38.2% Fib levels comes at 1.0931, expected to provide resistance. Similarly, the daily 61.8% fib level is at 1.0918, expected to provide resistance.
Note the levels of interest below:
- Pivot support is noted at 1.0885, 1.0864, 1.083
- Pivot resistance is noted at 1.094, 1.0974, 1.0996
| Levels | Levels.1 |
|---|---|
| Previous Daily High | 1.0952 |
| Previous Daily Low | 1.0897 |
| Previous Weekly High | 1.1065 |
| Previous Weekly Low | 1.0929 |
| Previous Monthly High | 1.1276 |
| Previous Monthly Low | 1.0834 |
| Daily Fibonacci 38.2% | 1.0931 |
| Daily Fibonacci 61.8% | 1.0918 |
| Daily Pivot Point S1 | 1.0885 |
| Daily Pivot Point S2 | 1.0864 |
| Daily Pivot Point S3 | 1.0830 |
| Daily Pivot Point R1 | 1.0940 |
| Daily Pivot Point R2 | 1.0974 |
| Daily Pivot Point R3 | 1.0996 |
[/s2If]
Download Nehcap EAWe have two EAs that are operational on our LIVE accounts.
- EA-FIX: Check out the details here. Download EA-FIX . EA-FIX is a non-grid HFT scalper.
- EA-GROWTH: High quality low dd EA using trend grids. Download EA_GROWTHJoin Our Telegram Group


