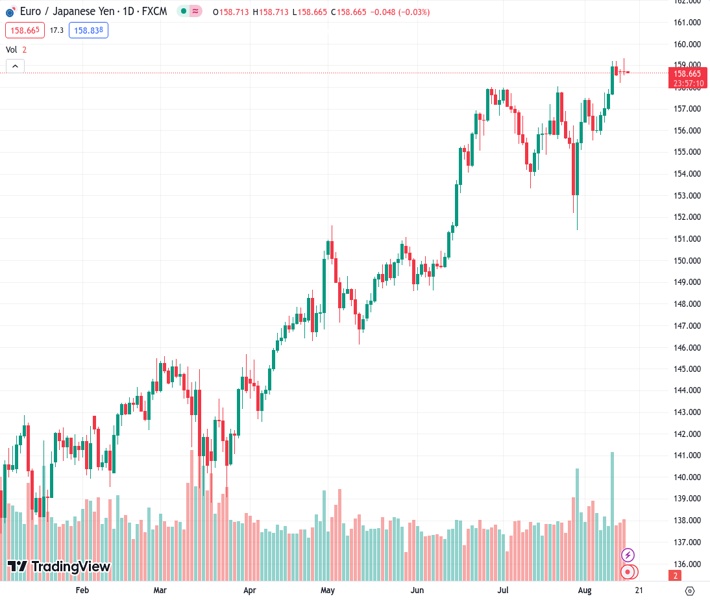
The EURJPY currency pair reached its highest point so far this year at 158.742, but quickly declined due to concerns of intervention as the Japanese yen’s position weakens.
…
This is a premium post.
[s2If !current_user_can(access_s2member_level4)]Please register for FREE REGISTER to read full post below containing analysis. In case of any error or you think you are not able to read the full post below, please email us at support#nehcap.com [lwa][/s2If] [s2If current_user_can(access_s2member_level1)]
- EUR/JPY touches a new YTD peak but retracts swiftly as intervention fears loom with JPY’s softening stance.
The pair currently trades last at 158.742.
The previous day high was 158.93 while the previous day low was 158.19. The daily 38.2% Fib levels comes at 158.65, expected to provide support. Similarly, the daily 61.8% fib level is at 158.47, expected to provide support.
The EUR/JPY rallied to a new year-to-date (YTD) high of 159.33 but failed to hold above the 159.00 figure as sellers gained momentum due to fears that Japanese authorities might intervene in the Forex market as the Japanese Yen (JPY) weakens. The EUR/JPY is trading at 158.74, printing minuscule gains of 0.02% as the New York session winds down.
The EUR/JPY cross-currency pair sits at around the 158.50/159.00 range for the second straight day in the week, failing to break above the 160.00 figure amidst a soft JPY. Technically speaking, in those days, back-to-back ‘doji’ suggests indecision lying ahead.
If EUR/JPY buyers lift the pair past the current YTD high, the next resistance would emerge at the 160.00 handle. Once cleared, the next resistance emerges at the August 2008 monthly high of 169.47.
Conversely, if EUR/JPY extends its losses below the current week’s low of 158.18, first support would emerge at the psychological 158.00 mark. If sellers push prices below that level, the Tenkan-Sen line surfaces as support at 157.43, followed by the Senkou-Span A line at 156.40 ahead of 156.00.
Technical Levels: Supports and Resistances
EURJPY currently trading at 158.75 at the time of writing. Pair opened at 158.74 and is trading with a change of 0.01 % .
| Overview | Overview.1 | |
|---|---|---|
| 0 | Today last price | 158.75 |
| 1 | Today Daily Change | 0.01 |
| 2 | Today Daily Change % | 0.01 |
| 3 | Today daily open | 158.74 |
The pair remains strongly bullish on the daily timeframe. It trades above its 20 SMA @ 156.67, 50 SMA 155.51, 100 SMA @ 151.54 and 200 SMA @ 147.08.
| Trends | Trends.1 | |
|---|---|---|
| 0 | Daily SMA20 | 156.67 |
| 1 | Daily SMA50 | 155.51 |
| 2 | Daily SMA100 | 151.54 |
| 3 | Daily SMA200 | 147.08 |
The previous day high was 158.93 while the previous day low was 158.19. The daily 38.2% Fib levels comes at 158.65, expected to provide support. Similarly, the daily 61.8% fib level is at 158.47, expected to provide support.
Note the levels of interest below:
- Pivot support is noted at 158.31, 157.88, 157.57
- Pivot resistance is noted at 159.05, 159.36, 159.79
| Levels | Levels.1 |
|---|---|
| Previous Daily High | 158.93 |
| Previous Daily Low | 158.19 |
| Previous Weekly High | 159.22 |
| Previous Weekly Low | 155.81 |
| Previous Monthly High | 158.05 |
| Previous Monthly Low | 151.41 |
| Daily Fibonacci 38.2% | 158.65 |
| Daily Fibonacci 61.8% | 158.47 |
| Daily Pivot Point S1 | 158.31 |
| Daily Pivot Point S2 | 157.88 |
| Daily Pivot Point S3 | 157.57 |
| Daily Pivot Point R1 | 159.05 |
| Daily Pivot Point R2 | 159.36 |
| Daily Pivot Point R3 | 159.79 |
[/s2If]
Download Nehcap EAWe have two EAs that are operational on our LIVE accounts.
- EA-FIX: Check out the details here. Download EA-FIX . EA-FIX is a non-grid HFT scalper.
- EA-GROWTH: High quality low dd EA using trend grids. Download EA_GROWTHJoin Our Telegram Group


