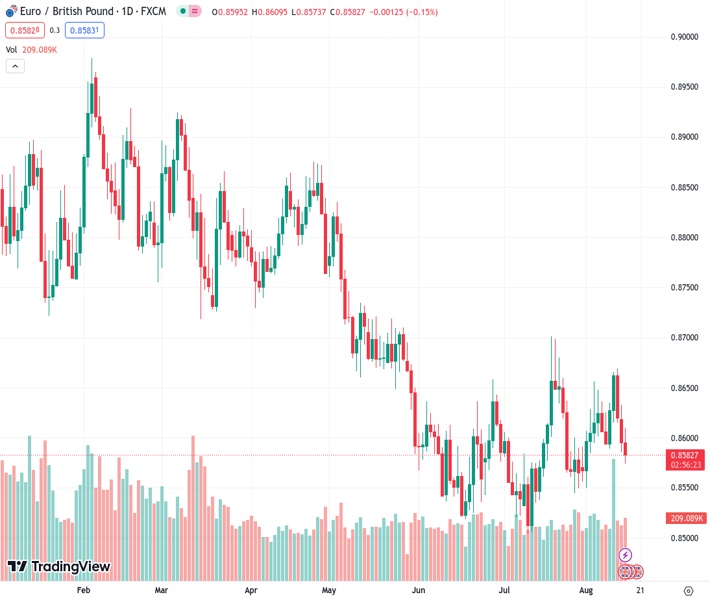
The euro against the British pound (EURGBP) has fallen below both the 50 and 20-day Exponential Moving Averages (EMAs), indicating a stronger pessimistic market sentiment. It is currently trading 0.14% lower than its initial price.
…
This is a premium post.
[s2If !current_user_can(access_s2member_level4)]Please register for FREE REGISTER to read full post below containing analysis. In case of any error or you think you are not able to read the full post below, please email us at support#nehcap.com [lwa][/s2If] [s2If current_user_can(access_s2member_level1)]
- EUR/GBP slips past 50 and 20-day EMAs, reflecting increased bearish sentiment, trading 0.14% below the opening.
The pair currently trades last at 0.85826.
The previous day high was 0.8633 while the previous day low was 0.8593. The daily 38.2% Fib levels comes at 0.8608, expected to provide resistance. Similarly, the daily 61.8% fib level is at 0.8617, expected to provide resistance.
The EUR/GBP dropped for the third consecutive day, extending its losses past the 50 and 20-day Exponential Moving Averages (EMAs), the last time seen each at 0.8610 and 0.8603. At the time of writing, the EUR/GBP is trading at 0.8582, below its opening price by 0.14%.
The EUR/GBP is trading sideways, slightly tilted to the downside, after prices fell below all the daily Exponential Moving Averages (EMAs), opening the door for further losses. Notably, the EUR/GBP fell to a new two-week low, and on its way down, it has broken a one-month-old support trendline drawn from the yearly lows, suggesting that sellers are gathering momentum.
If EUR/GBP achieves a daily close below 0.8600, the cross could extend its downtrend to the July 27 swing low of 0.8544 before challenging the year-to-date (YTD) low of 0.8504.
On the flip side, if EUR/GBP buyers reclaim 0.8600, the first resistance levels would be the 0.8601/10 area, followed by the 100-day EMA at 0.8646.
Technical Levels: Supports and Resistances
EURGBP currently trading at 0.8584 at the time of writing. Pair opened at 0.8596 and is trading with a change of -0.14 % .
| Overview | Overview.1 | |
|---|---|---|
| 0 | Today last price | 0.8584 |
| 1 | Today Daily Change | -0.0012 |
| 2 | Today Daily Change % | -0.1400 |
| 3 | Today daily open | 0.8596 |
The pair remains strongly bearish on the daily time frame. It trades below the 20 SMA @ 0.8611, 50 SMA 0.8588, 100 SMA @ 0.8667 and 200 SMA @ 0.8723.
| Trends | Trends.1 | |
|---|---|---|
| 0 | Daily SMA20 | 0.8611 |
| 1 | Daily SMA50 | 0.8588 |
| 2 | Daily SMA100 | 0.8667 |
| 3 | Daily SMA200 | 0.8723 |
The previous day high was 0.8633 while the previous day low was 0.8593. The daily 38.2% Fib levels comes at 0.8608, expected to provide resistance. Similarly, the daily 61.8% fib level is at 0.8617, expected to provide resistance.
Note the levels of interest below:
- Pivot support is noted at 0.8582, 0.8567, 0.8542
- Pivot resistance is noted at 0.8622, 0.8647, 0.8662
| Levels | Levels.1 |
|---|---|
| Previous Daily High | 0.8633 |
| Previous Daily Low | 0.8593 |
| Previous Weekly High | 0.8669 |
| Previous Weekly Low | 0.8590 |
| Previous Monthly High | 0.8701 |
| Previous Monthly Low | 0.8504 |
| Daily Fibonacci 38.2% | 0.8608 |
| Daily Fibonacci 61.8% | 0.8617 |
| Daily Pivot Point S1 | 0.8582 |
| Daily Pivot Point S2 | 0.8567 |
| Daily Pivot Point S3 | 0.8542 |
| Daily Pivot Point R1 | 0.8622 |
| Daily Pivot Point R2 | 0.8647 |
| Daily Pivot Point R3 | 0.8662 |
[/s2If]
Download Nehcap EAWe have two EAs that are operational on our LIVE accounts.
- EA-FIX: Check out the details here. Download EA-FIX . EA-FIX is a non-grid HFT scalper.
- EA-GROWTH: High quality low dd EA using trend grids. Download EA_GROWTHJoin Our Telegram Group


