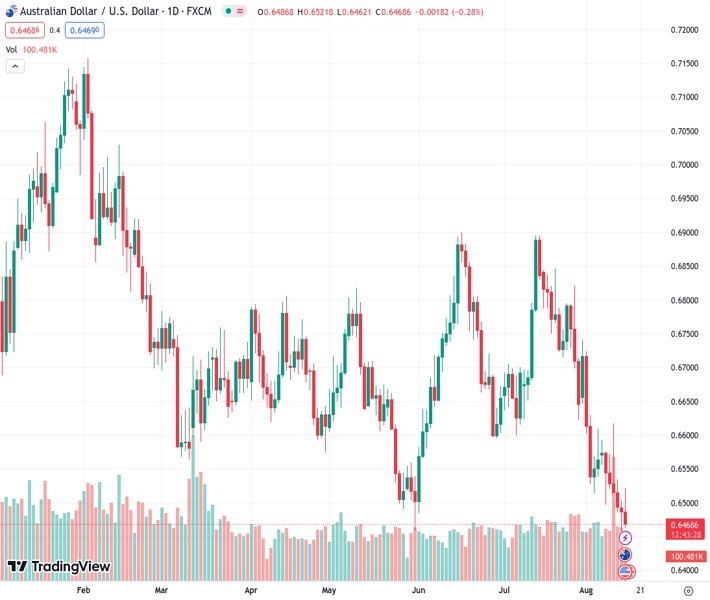
The AUDUSD pair, currently at a rate of 0.64680, is experiencing a continued decline for the sixth consecutive day, moving closer to its lowest level thus far in the year.
…
This is a premium post.
[s2If !current_user_can(access_s2member_level4)]Please register for FREE REGISTER to read full post below containing analysis. In case of any error or you think you are not able to read the full post below, please email us at support#nehcap.com [lwa][/s2If] [s2If current_user_can(access_s2member_level1)]
- AUD/USD turns lower for the sixth straight day and slides back closer to the YTD low.
The pair currently trades last at 0.64680.
The previous day high was 0.6507 while the previous day low was 0.6454. The daily 38.2% Fib levels comes at 0.6474, expected to provide resistance. Similarly, the daily 61.8% fib level is at 0.6487, expected to provide resistance.
The AUD/USD pair fades an intraday bullish spike to the 0.6520 region and retreats to the lower end of its daily range during the early part of the European session on Tuesday. Spot prices currently trade around the 0.6470 area, down for the sixth straight day and well within the striking distance of the YTD trough touched on Monday.
The initial market reaction to a surprise rate cut by the People’s Bank of China (PBoC) fizzles out rather quickly on the back of concerns that China’s post-pandemic recovery has slowed after a brisk start in the first quarter. The fears were further fueled by another round of disappointing macro data from China – including Retail Sales, Industrial Production, Fixed Asset Investment and the urban unemployment rate. This, in turn, undermines the China-proxy Australian Dollar (AUD), which, along with the underlying bullish sentiment surrounding the US Dollar (USD), continues to exert some downward pressure on the AUD/USD pair.
The USD Index (DXY), which tracks the Greenback against a basket of currencies, trades just below its highest level in more than two months and remains supported by expectations that the Federal Reserve (Fed) will stick to its hawkish stance. The outlook pushes the yield on the benchmark 10-year US government bond to a nine-month peak and supports prospects for a further near-term appreciating move for the buck. The Aussie bulls, meanwhile, seem unimpressed by the Reserve Bank of Australia’s (RBA) August meeting minutes, which showed that policymakers saw a “credible path” back to the inflation target with the current cash rates at 4.1%.
The aforementioned fundamental backdrop, along with a confirmed bearish double-top breakdown, suggests that the path of least resistance for the AUD/USD pair is to the downside. Some follow-through selling below mid-0.6400s, or the lowest level since November 2022 set the previous day, will reaffirm the negative bias and pave the way for an extension of a one-month-old downtrend. Traders now look to the US economic docket, featuring monthly Retail Sales and the Empire State Manufacturing Index, later during the early North American session. Apart from this, the broader risk should provide a fresh impetus to the major.
Technical Levels: Supports and Resistances
AUDUSD currently trading at 0.6468 at the time of writing. Pair opened at 0.6487 and is trading with a change of -0.29 % .
| Overview | Overview.1 | |
|---|---|---|
| 0 | Today last price | 0.6468 |
| 1 | Today Daily Change | -0.0019 |
| 2 | Today Daily Change % | -0.2900 |
| 3 | Today daily open | 0.6487 |
The pair remains strongly bearish on the daily time frame. It trades below the 20 SMA @ 0.6644, 50 SMA 0.6697, 100 SMA @ 0.668 and 200 SMA @ 0.6737.
| Trends | Trends.1 | |
|---|---|---|
| 0 | Daily SMA20 | 0.6644 |
| 1 | Daily SMA50 | 0.6697 |
| 2 | Daily SMA100 | 0.6680 |
| 3 | Daily SMA200 | 0.6737 |
The previous day high was 0.6507 while the previous day low was 0.6454. The daily 38.2% Fib levels comes at 0.6474, expected to provide resistance. Similarly, the daily 61.8% fib level is at 0.6487, expected to provide resistance.
Note the levels of interest below:
- Pivot support is noted at 0.6458, 0.643, 0.6405
- Pivot resistance is noted at 0.6511, 0.6536, 0.6565
| Levels | Levels.1 |
|---|---|
| Previous Daily High | 0.6507 |
| Previous Daily Low | 0.6454 |
| Previous Weekly High | 0.6617 |
| Previous Weekly Low | 0.6486 |
| Previous Monthly High | 0.6895 |
| Previous Monthly Low | 0.6599 |
| Daily Fibonacci 38.2% | 0.6474 |
| Daily Fibonacci 61.8% | 0.6487 |
| Daily Pivot Point S1 | 0.6458 |
| Daily Pivot Point S2 | 0.6430 |
| Daily Pivot Point S3 | 0.6405 |
| Daily Pivot Point R1 | 0.6511 |
| Daily Pivot Point R2 | 0.6536 |
| Daily Pivot Point R3 | 0.6565 |
[/s2If]
Download Nehcap EAWe have two EAs that are operational on our LIVE accounts.
- EA-FIX: Check out the details here. Download EA-FIX . EA-FIX is a non-grid HFT scalper.
- EA-GROWTH: High quality low dd EA using trend grids. Download EA_GROWTHJoin Our Telegram Group


