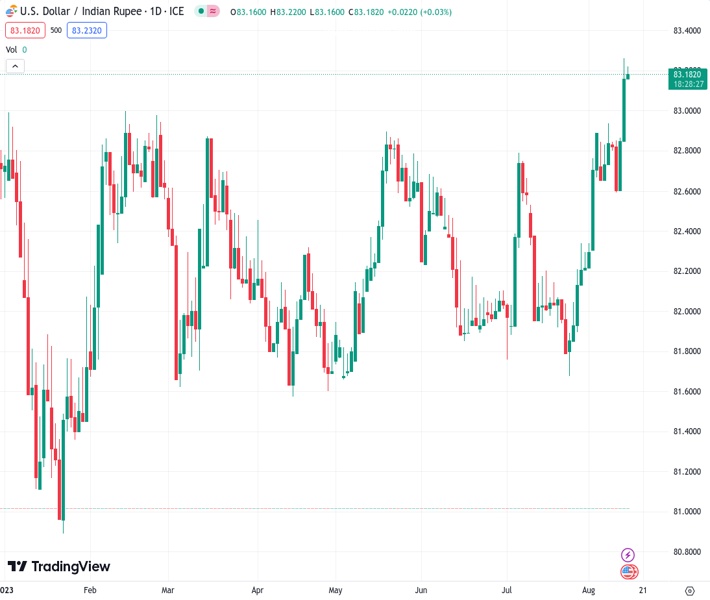
The US dollar to Indian rupee exchange rate stands at 83.2020, with bullish investors in control and driving the market to its year-to-date high for the third day in a row. Analysts predict that there will be more gains in the future.
…
This is a premium post.
[s2If !current_user_can(access_s2member_level4)]Please register for FREE REGISTER to read full post below containing analysis. In case of any error or you think you are not able to read the full post below, please email us at support#nehcap.com [lwa][/s2If] [s2If current_user_can(access_s2member_level1)]
- USD/INR bulls occupy driver’s seat at YTD top, up for the third consecutive day.
The pair currently trades last at 83.2020.
The previous day high was 83.2926 while the previous day low was 82.8946. The daily 38.2% Fib levels comes at 83.1405, expected to provide support. Similarly, the daily 61.8% fib level is at 83.0466, expected to provide support.
USD/INR defends the previous day’s upside break of the key resistance line while sticking to mild intraday gains around the yearly high amid early Tuesday. With this, the Indian Rupee (INR) pair prints a three-day winning streak near 83.20 by the press time.
Not only an upside break of the rising resistance line from early November 2022, now immediate support near the 83.00 round figure, but the bullish MACD signals also favor the USD/INR pair buyers.
It’s worth noting, however, that the RSI (14) line is nearly overbought and hence highlights the previous yearly peak of around 83.30, also the all-time high, as the key hurdle for the USD/INR bulls.
In a case where the India Rupee (INR) sellers dominate past 83.30, the odds of witnessing the pair’s rally towards the 84.00 round figure can’t be ruled out.
On the flip side, a daily closing below the resistance-turned-support line of around 83.00 becomes necessary for the USD/INR sellers to return.
Even so, a three-week-old ascending support line surrounding 82.75 will act as the last defense of the USD/INR bulls.
Above all, the Indian Rupee bears remain hopeful unless the quote provides a daily closing below the 200-DMA level of 82.15.
Trend: Further upside expected
Technical Levels: Supports and Resistances
USDINR currently trading at 83.2417 at the time of writing. Pair opened at 83.2886 and is trading with a change of -0.06% % .
| Overview | Overview.1 | |
|---|---|---|
| 0 | Today last price | 83.2417 |
| 1 | Today Daily Change | -0.0469 |
| 2 | Today Daily Change % | -0.06% |
| 3 | Today daily open | 83.2886 |
The pair remains strongly bullish on the daily timeframe. It trades above its 20 SMA @ 82.4711, 50 SMA 82.3008, 100 SMA @ 82.2336 and 200 SMA @ 82.18.
| Trends | Trends.1 | |
|---|---|---|
| 0 | Daily SMA20 | 82.4711 |
| 1 | Daily SMA50 | 82.3008 |
| 2 | Daily SMA100 | 82.2336 |
| 3 | Daily SMA200 | 82.1800 |
The previous day high was 83.2926 while the previous day low was 82.8946. The daily 38.2% Fib levels comes at 83.1405, expected to provide support. Similarly, the daily 61.8% fib level is at 83.0466, expected to provide support.
Note the levels of interest below:
- Pivot support is noted at 83.0245, 82.7605, 82.6265
- Pivot resistance is noted at 83.4225, 83.5566, 83.8206
| Levels | Levels.1 |
|---|---|
| Previous Daily High | 83.2926 |
| Previous Daily Low | 82.8946 |
| Previous Weekly High | 83.0466 |
| Previous Weekly Low | 82.5854 |
| Previous Monthly High | 82.8334 |
| Previous Monthly Low | 81.6588 |
| Daily Fibonacci 38.2% | 83.1405 |
| Daily Fibonacci 61.8% | 83.0466 |
| Daily Pivot Point S1 | 83.0245 |
| Daily Pivot Point S2 | 82.7605 |
| Daily Pivot Point S3 | 82.6265 |
| Daily Pivot Point R1 | 83.4225 |
| Daily Pivot Point R2 | 83.5566 |
| Daily Pivot Point R3 | 83.8206 |
[/s2If]
Download Nehcap EAWe have two EAs that are operational on our LIVE accounts.
- EA-FIX: Check out the details here. Download EA-FIX . EA-FIX is a non-grid HFT scalper.
- EA-GROWTH: High quality low dd EA using trend grids. Download EA_GROWTHJoin Our Telegram Group


