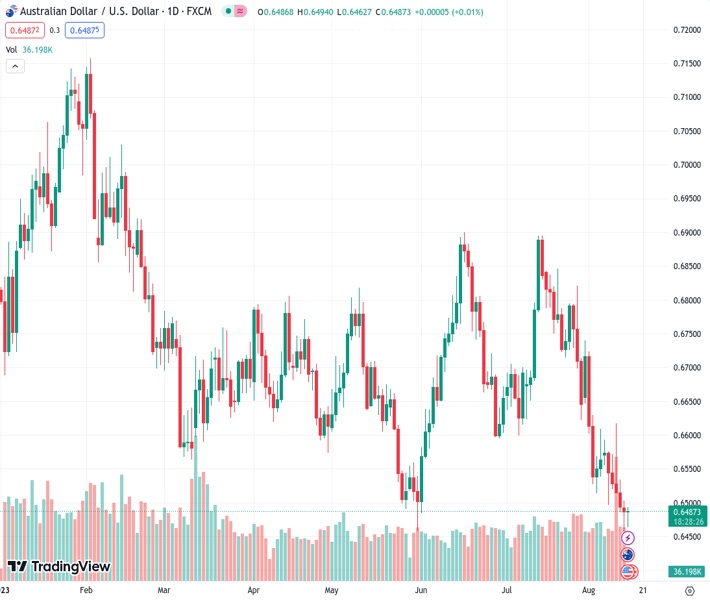
The AUDUSD currency pair is fluctuating within a small range slightly higher than its lowest level this year, which was reached on Monday.
…
This is a premium post.
[s2If !current_user_can(access_s2member_level4)]Please register for FREE REGISTER to read full post below containing analysis. In case of any error or you think you are not able to read the full post below, please email us at support#nehcap.com [lwa][/s2If] [s2If current_user_can(access_s2member_level1)]
- AUD/USD oscillates in a narrow range just above the YTD trough touched on Monday.
The pair currently trades last at 0.64869.
The previous day high was 0.6507 while the previous day low was 0.6454. The daily 38.2% Fib levels comes at 0.6474, expected to provide support. Similarly, the daily 61.8% fib level is at 0.6487, expected to provide resistance.
The AUD/USD pair struggles to capitalize on the previous day’s modest bounce from the vicinity of mid-0.6400s, or its lowest level since November 2022 and edges lower during the Asian session on Tuesday. Spot prices currently trade around the 0.6485 region, nearly unchanged for the day, and seem vulnerable to prolonging the recent downward trajectory witnessed over the past month or so.
Despite surprise rate cuts by the People’s Bank of China (PBoC), growing concerns about the worsening economic outlook in China continues to undermine the Australian Dollar (AUD). In fact, the PBoC lowered its benchmark rate – Medium-term Lending Facility (MLF) – to 2.5% from 2.65% and the reverse repo rate to 1.8% from 1.9%. This, however, was overshadowed by the disappointing Chinese macro data released today, which showed that Retail Sales and Industrial Production grew less than anticipated in July.
Meanwhile, minutes of the Reserve Bank of Australia’s August 2023 policy meeting revealed that the default position now is to hold interest rates steady. Policymakers agreed that some further tightening might be needed, though saw a “credible path” back to the inflation target with the current cash rates at 4.1%. This, along with softer-than-expected Aussie wage data, which grew 0.8% in Q2, contributes to capping the upside for the AUD/USD pair amid the underlying bullish tone surrounding the US Dollar (USD).
The US CPI and the PPI report released last week indicated that the battle to bring inflation back to the Fed’s 2% target is far from being won. This should allow the Federal Reserve (Fed) to stick to its hawkish stance and keep interest rates higher for longer, which remains supportive of elevated US Treasury bond yields and continues to underpin the Greenback. This further contributes to capping the AUD/USD pair and suggests that the path of least resistance for spot prices remains to the downside.
Market participants now look to the US economic docket, highlighting the release of monthly Retail Sales and the Empire State Manufacturing Index later during the early North American session. This, along with the US bond yields and the broader risk sentiment, will influence the USD price dynamics and provide some meaningful impetus to the AUD/USD pair. The aforementioned fundamental backdrop, meanwhile, seems tilted firmly in favour of bearish traders and supports prospects for further losses.
Technical Levels: Supports and Resistances
AUDUSD currently trading at 0.6478 at the time of writing. Pair opened at 0.6487 and is trading with a change of -0.14 % .
| Overview | Overview.1 | |
|---|---|---|
| 0 | Today last price | 0.6478 |
| 1 | Today Daily Change | -0.0009 |
| 2 | Today Daily Change % | -0.1400 |
| 3 | Today daily open | 0.6487 |
The pair remains strongly bearish on the daily time frame. It trades below the 20 SMA @ 0.6644, 50 SMA 0.6697, 100 SMA @ 0.668 and 200 SMA @ 0.6737.
| Trends | Trends.1 | |
|---|---|---|
| 0 | Daily SMA20 | 0.6644 |
| 1 | Daily SMA50 | 0.6697 |
| 2 | Daily SMA100 | 0.6680 |
| 3 | Daily SMA200 | 0.6737 |
The previous day high was 0.6507 while the previous day low was 0.6454. The daily 38.2% Fib levels comes at 0.6474, expected to provide support. Similarly, the daily 61.8% fib level is at 0.6487, expected to provide resistance.
Note the levels of interest below:
- Pivot support is noted at 0.6458, 0.643, 0.6405
- Pivot resistance is noted at 0.6511, 0.6536, 0.6565
| Levels | Levels.1 |
|---|---|
| Previous Daily High | 0.6507 |
| Previous Daily Low | 0.6454 |
| Previous Weekly High | 0.6617 |
| Previous Weekly Low | 0.6486 |
| Previous Monthly High | 0.6895 |
| Previous Monthly Low | 0.6599 |
| Daily Fibonacci 38.2% | 0.6474 |
| Daily Fibonacci 61.8% | 0.6487 |
| Daily Pivot Point S1 | 0.6458 |
| Daily Pivot Point S2 | 0.6430 |
| Daily Pivot Point S3 | 0.6405 |
| Daily Pivot Point R1 | 0.6511 |
| Daily Pivot Point R2 | 0.6536 |
| Daily Pivot Point R3 | 0.6565 |
[/s2If]
Download Nehcap EAWe have two EAs that are operational on our LIVE accounts.
- EA-FIX: Check out the details here. Download EA-FIX . EA-FIX is a non-grid HFT scalper.
- EA-GROWTH: High quality low dd EA using trend grids. Download EA_GROWTHJoin Our Telegram Group


