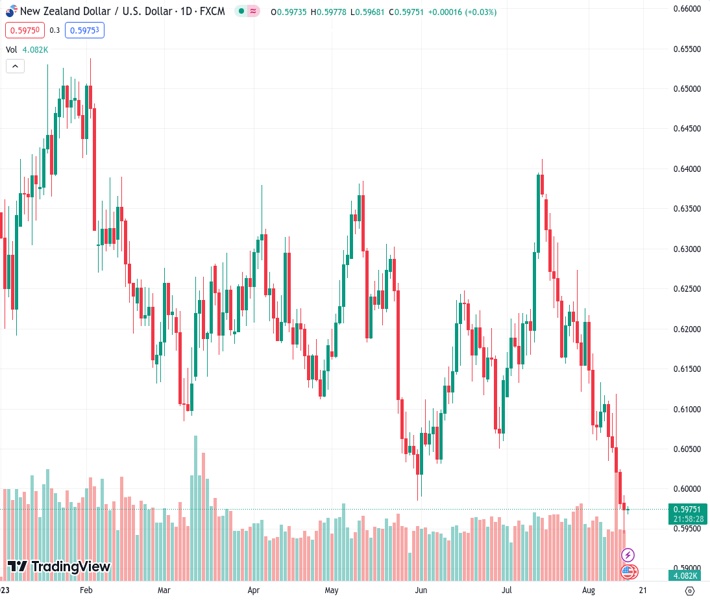
In the early Asian session, the NZDUSD pair has decreased slightly from 0.59769 to 0.5970, reaching its lowest point since mid-November.
…
This is a premium post.
[s2If !current_user_can(access_s2member_level4)]Please register for FREE REGISTER to read full post below containing analysis. In case of any error or you think you are not able to read the full post below, please email us at support#nehcap.com [lwa][/s2If] [s2If current_user_can(access_s2member_level1)]
- NZD/USD edges lower to 0.5970, the lowest level since mid-November in the early Asian session.
The pair currently trades last at 0.59769.
The previous day high was 0.6089 while the previous day low was 0.5974. The daily 38.2% Fib levels comes at 0.6018, expected to provide resistance. Similarly, the daily 61.8% fib level is at 0.6045, expected to provide resistance.
The NZD/USD pair extends its downside and holds below the 0.6000 barrier on Tuesday. The pair trades at its lowest level since mid-November and is currently near 0.5970, losing 0.07% in the early Asian session. A rise in US yields is the main driver of the USD’s strength. The 10-year yield is at 4.20%, while the 2-year yield stays at 4.97%. Market participants await the Reserve Bank of New Zealand (RBNZ) interest rate decision on Wednesday, with the rate expected to remain unchanged at 5.5%.
Market players are convinced that the Federal Reserve (Fed) will keep the interest rate unchanged in its September meeting. However, the odds for an additional rate hike of 25 basis points (bps) increased to almost 40% in November. That said, the US Retail Sales from July and FOMC Minutes due later this week will offer hints for further monetary policy for the entire year. More hawkish comments from Fed policymakers might boost the Greenback and acts as a headwind for the NZD/USD pair.
There were no relevant economic data released from the US docket on Monday. Last week, the US Bureau of Labour Statistics revealed that the US Producer Price Index (PPI) for final demand YoY rose 0.8% in July from 0.1% in June. The figure was higher than the market expectation of 0.7%. Additionally, the University of Michigan’s (UoM) Consumer Confidence Index for July fell to 71.2 from 71.6, better than 71 expected. Finally, UoM 5-year Consumer Inflation Expectations declined to 2.9% for August versus 3.0% estimated and prior.
On the Kiwi front, the majority of analysts anticipate that the Reserve Bank of New Zealand (RBNZ) will maintain rates at 5.50%, a 14-year high, for the second consecutive meeting on Wednesday, according to a Reuters poll. The New Zealand Dollar might extend its downside with a dovish stance by the RBNZ.
Looking ahead, investors will keep an eye on the RBNZ Interest Rate Decision scheduled for Wednesday and the New Zealand’s Producer Price Index due on Thursday. Also, the US Retail Sales and FOMC minutes will be the key events. The monthly Retail Sales figure is expected to rise from 0.2% to 0.4% in July. The data will be critical for determining a clear movement for the NZD/USD pair.
Technical Levels: Supports and Resistances
NZDUSD currently trading at 0.5976 at the time of writing. Pair opened at 0.5984 and is trading with a change of -0.13 % .
| Overview | Overview.1 | |
|---|---|---|
| 0 | Today last price | 0.5976 |
| 1 | Today Daily Change | -0.0008 |
| 2 | Today Daily Change % | -0.1300 |
| 3 | Today daily open | 0.5984 |
The pair remains strongly bearish on the daily time frame. It trades below the 20 SMA @ 0.6153, 50 SMA 0.6164, 100 SMA @ 0.6184 and 200 SMA @ 0.6233.
| Trends | Trends.1 | |
|---|---|---|
| 0 | Daily SMA20 | 0.6153 |
| 1 | Daily SMA50 | 0.6164 |
| 2 | Daily SMA100 | 0.6184 |
| 3 | Daily SMA200 | 0.6233 |
The previous day high was 0.6089 while the previous day low was 0.5974. The daily 38.2% Fib levels comes at 0.6018, expected to provide resistance. Similarly, the daily 61.8% fib level is at 0.6045, expected to provide resistance.
Note the levels of interest below:
- Pivot support is noted at 0.5942, 0.5901, 0.5827
- Pivot resistance is noted at 0.6057, 0.613, 0.6172
| Levels | Levels.1 |
|---|---|
| Previous Daily High | 0.6089 |
| Previous Daily Low | 0.5974 |
| Previous Weekly High | 0.6118 |
| Previous Weekly Low | 0.5974 |
| Previous Monthly High | 0.6413 |
| Previous Monthly Low | 0.6120 |
| Daily Fibonacci 38.2% | 0.6018 |
| Daily Fibonacci 61.8% | 0.6045 |
| Daily Pivot Point S1 | 0.5942 |
| Daily Pivot Point S2 | 0.5901 |
| Daily Pivot Point S3 | 0.5827 |
| Daily Pivot Point R1 | 0.6057 |
| Daily Pivot Point R2 | 0.6130 |
| Daily Pivot Point R3 | 0.6172 |
[/s2If]
Download Nehcap EAWe have two EAs that are operational on our LIVE accounts.
- EA-FIX: Check out the details here. Download EA-FIX . EA-FIX is a non-grid HFT scalper.
- EA-GROWTH: High quality low dd EA using trend grids. Download EA_GROWTHJoin Our Telegram Group


