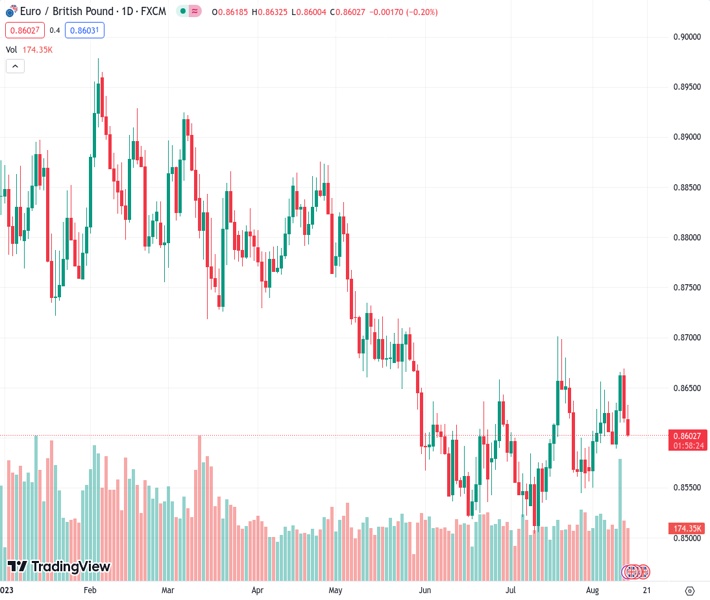
The EURGBP currency pair, which was trading at a value of 0.86034, experienced a decrease for two days in a row and dropped further towards 0.8605, falling below the 20-day Simple Moving Average (SMA).
…
This is a premium post.
[s2If !current_user_can(access_s2member_level4)]Please register for FREE REGISTER to read full post below containing analysis. In case of any error or you think you are not able to read the full post below, please email us at support#nehcap.com [lwa][/s2If] [s2If current_user_can(access_s2member_level1)]
- EUR/GBP declined for a second consecutive day, and fell towards 0.8605, below the 20-day SMA.
The pair currently trades last at 0.86034.
The previous day high was 0.8669 while the previous day low was 0.8618. The daily 38.2% Fib levels comes at 0.8638, expected to provide resistance. Similarly, the daily 61.8% fib level is at 0.865, expected to provide resistance.
At the start of the week, the EUR/GBP fell below the 20-day Simple Moving Average (SMA) near the 0.8605 area. No relevant data releases will feature on Monday’s economic calendar as attention shifts fo high-tier data released from both blocks later in the week.
On the GBP’s side, on Tuesday, the Office for National Statistics (ONS) will release key labour market data, including earning figures from the three months up to June and Claimant Counts numbers from July. In addition, on Wednesday, inflation data will be released from July, and overall figures are expected to show a robust labour market and decelerating inflation. Its worth noticing that the Bank of England (BoE) no longer expects a recession but that the bank will do whatever it takes to bring down inflation, so the outcome of the data will likely shape the expectations of the BoE’s next decision and hence having an impact on the Pound’s price dynamics.
On the European side, markets await Gross Domestic Product (GDP) preliminary figures for Q2 from the Eurozone, which is expected to have stagnated, and the Harmonized Index of Consumer Prices (HIICP) from July, which will be released on Friday.
The daily chart suggests that a neutral to bearish trend becomes evident for EUR/GBP, with the bears gradually taking control. The Relative Strength Index (RSI) has a negative slope above its midline, indicating weakening buying pressure, while the Moving Average Convergence (MACD) prints decreasing green bars. In addition, the pair is below the 20,100 and 200-day Simple Moving Average (SMA), pointing towards the prevailing strength of the bears in the larger context.
Support levels: 0.8600, 0.8590, 0.8570.
Resistance levels: 0.8610 (20-day SMA), 0.8630, 0.8650.
Technical Levels: Supports and Resistances
EURGBP currently trading at 0.8602 at the time of writing. Pair opened at 0.8625 and is trading with a change of -0.27 % .
| Overview | Overview.1 | |
|---|---|---|
| 0 | Today last price | 0.8602 |
| 1 | Today Daily Change | -0.0023 |
| 2 | Today Daily Change % | -0.2700 |
| 3 | Today daily open | 0.8625 |
The pair is trading below its 20 Daily moving average @ 0.8611, above its 50 Daily moving average @ 0.8588 , below its 100 Daily moving average @ 0.8669 and below its 200 Daily moving average @ 0.8724
| Trends | Trends.1 | |
|---|---|---|
| 0 | Daily SMA20 | 0.8611 |
| 1 | Daily SMA50 | 0.8588 |
| 2 | Daily SMA100 | 0.8669 |
| 3 | Daily SMA200 | 0.8724 |
The previous day high was 0.8669 while the previous day low was 0.8618. The daily 38.2% Fib levels comes at 0.8638, expected to provide resistance. Similarly, the daily 61.8% fib level is at 0.865, expected to provide resistance.
Note the levels of interest below:
- Pivot support is noted at 0.8606, 0.8587, 0.8555
- Pivot resistance is noted at 0.8657, 0.8688, 0.8707
| Levels | Levels.1 |
|---|---|
| Previous Daily High | 0.8669 |
| Previous Daily Low | 0.8618 |
| Previous Weekly High | 0.8669 |
| Previous Weekly Low | 0.8590 |
| Previous Monthly High | 0.8701 |
| Previous Monthly Low | 0.8504 |
| Daily Fibonacci 38.2% | 0.8638 |
| Daily Fibonacci 61.8% | 0.8650 |
| Daily Pivot Point S1 | 0.8606 |
| Daily Pivot Point S2 | 0.8587 |
| Daily Pivot Point S3 | 0.8555 |
| Daily Pivot Point R1 | 0.8657 |
| Daily Pivot Point R2 | 0.8688 |
| Daily Pivot Point R3 | 0.8707 |
[/s2If]
Download Nehcap EAWe have two EAs that are operational on our LIVE accounts.
- EA-FIX: Check out the details here. Download EA-FIX . EA-FIX is a non-grid HFT scalper.
- EA-GROWTH: High quality low dd EA using trend grids. Download EA_GROWTHJoin Our Telegram Group


