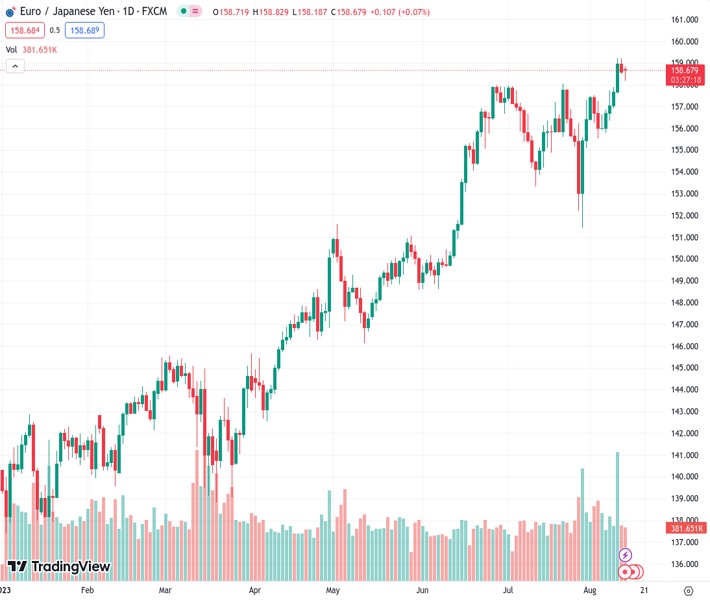
The EURJPY currency pair experienced consecutive losses and dropped close to the 158.60 region.
…
This is a premium post.
[s2If !current_user_can(access_s2member_level4)]Please register for FREE REGISTER to read full post below containing analysis. In case of any error or you think you are not able to read the full post below, please email us at support#nehcap.com [lwa][/s2If] [s2If current_user_can(access_s2member_level1)]
- EUR/JPY traded with losses for a consecutive day, and fell near the 158.60 area.
The pair currently trades last at 158.707.
The previous day high was 159.22 while the previous day low was 158.53. The daily 38.2% Fib levels comes at 158.8, expected to provide resistance. Similarly, the daily 61.8% fib level is at 158.96, expected to provide resistance.
At the start of the week, the EUR/JPY traded with mild losses below 159.00. Both currencies traded weakly against their rivals on a quiet Monday ahead of the Gross Domestic Product (GDP) data from Japan and the Eurozone this week. On the JPY’s side, the USD/JPY broke through the 145.00 key level for the first time since November 2022, but there are still no signs of intervention from the local authorities to limit Yen’s losses.
Economic activity figures will be the week’s highlight for the pair. On the Japanese side, on Tuesday, the Q2 Gross Domestic Product (GDP) figures will be released and are expected to have grown at an annualised pace of 3.1%. That being said, there are no signs from the Bank of Japan (BoJ) to pivot its dovish monetary policy or to intervene in the markets to control the JPY’s downfall, which could pave the way for further downside for the pair.
On the European side, the Preliminary GDP figures from Q2 from the Euro area are expected to come in at 0.6% YoY matching the previous quarterly figures. In addition, inflation data will be released from the Eurozone and both sets of data will help investors to model their expectations towards the next European Central Bank (ECB) decisions.
The EUR/JPY suggests a neutral to bearish technical outlook on the daily chart as bullish momentum wanes. Having turned flat in positive territory, the Relative Strength Index (RSI) suggests a potential market equilibrium with balanced buying and selling pressure, while the Moving Average Convergence (MACD) histogram prints stagnant green bars. On the other hand, the pair is above the 20,100,200-day Simple Moving Average (SMA), indicating that the buyers are commanding the broader perspective.
Support levels: 158.00, 157.00, 156.00.
Resistance levels: 159.00, 160.00, 161.00.
Technical Levels: Supports and Resistances
EURJPY currently trading at 158.76 at the time of writing. Pair opened at 158.72 and is trading with a change of 0.03 % .
| Overview | Overview.1 | |
|---|---|---|
| 0 | Today last price | 158.76 |
| 1 | Today Daily Change | 0.04 |
| 2 | Today Daily Change % | 0.03 |
| 3 | Today daily open | 158.72 |
The pair remains strongly bullish on the daily timeframe. It trades above its 20 SMA @ 156.52, 50 SMA 155.33, 100 SMA @ 151.38 and 200 SMA @ 147.02.
| Trends | Trends.1 | |
|---|---|---|
| 0 | Daily SMA20 | 156.52 |
| 1 | Daily SMA50 | 155.33 |
| 2 | Daily SMA100 | 151.38 |
| 3 | Daily SMA200 | 147.02 |
The previous day high was 159.22 while the previous day low was 158.53. The daily 38.2% Fib levels comes at 158.8, expected to provide resistance. Similarly, the daily 61.8% fib level is at 158.96, expected to provide resistance.
Note the levels of interest below:
- Pivot support is noted at 158.43, 158.14, 157.74
- Pivot resistance is noted at 159.12, 159.52, 159.81
| Levels | Levels.1 |
|---|---|
| Previous Daily High | 159.22 |
| Previous Daily Low | 158.53 |
| Previous Weekly High | 159.22 |
| Previous Weekly Low | 155.81 |
| Previous Monthly High | 158.05 |
| Previous Monthly Low | 151.41 |
| Daily Fibonacci 38.2% | 158.80 |
| Daily Fibonacci 61.8% | 158.96 |
| Daily Pivot Point S1 | 158.43 |
| Daily Pivot Point S2 | 158.14 |
| Daily Pivot Point S3 | 157.74 |
| Daily Pivot Point R1 | 159.12 |
| Daily Pivot Point R2 | 159.52 |
| Daily Pivot Point R3 | 159.81 |
[/s2If]
Download Nehcap EAWe have two EAs that are operational on our LIVE accounts.
- EA-FIX: Check out the details here. Download EA-FIX . EA-FIX is a non-grid HFT scalper.
- EA-GROWTH: High quality low dd EA using trend grids. Download EA_GROWTHJoin Our Telegram Group


