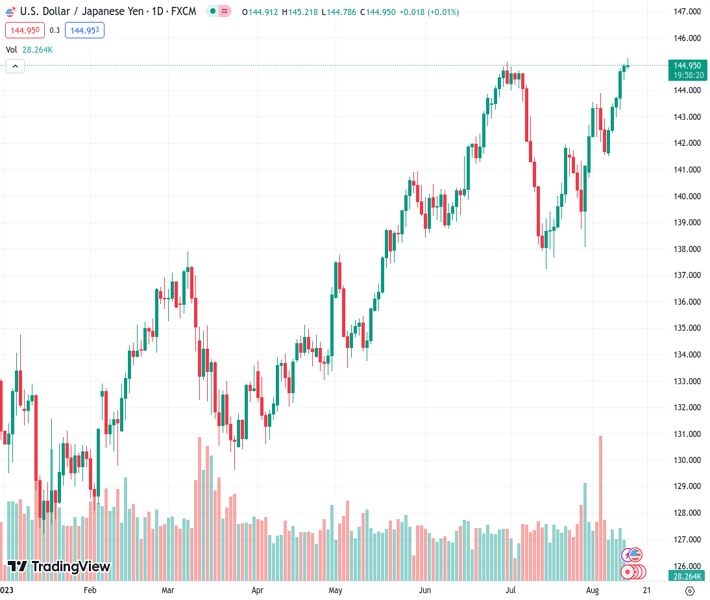
The USDJPY currency pair has risen to its highest point since November 2022, although it has not been able to maintain this momentum.
…
This is a premium post.
[s2If !current_user_can(access_s2member_level4)]Please register for FREE REGISTER to read full post below containing analysis. In case of any error or you think you are not able to read the full post below, please email us at support#nehcap.com [lwa][/s2If] [s2If current_user_can(access_s2member_level1)]
- USD/JPY climbs to its highest level since November 2022, albeit lacks follow-through.
The pair currently trades last at 144.972.
The previous day high was 145.0 while the previous day low was 144.42. The daily 38.2% Fib levels comes at 144.78, expected to provide support. Similarly, the daily 61.8% fib level is at 144.64, expected to provide support.
The USD/JPY pair kicks off the new week on a positive note and touches a fresh YTD peak during the Asian session. Spot prices, however, retreat a few pips in the last hour and now seem to have stabilized around the 145.00 psychological mark.
The US Dollar (USD) climbs to a fresh peak since July 7 and continues to draw support from rising bets for further tightening by the Federal Reserve (Fed), which, in turn, is seen as a key factor acting as a tailwind for the USD/JPY pair. The fact that the consumer inflation in the US remains well above the central bank’s 2% target, along with worries that rising energy costs will push up the Consumer Price Index (CPI), keeps the door open for one more 25 bps lift-off by the end of this year.
Adding to this, a slightly bigger rise in the US Producer Price Index (PPI) in July remains supportive of a further rise in the US Treasury bond yields and validates the hawkish Fed expectations. This marks a big divergence in comparison to a more dovish stance adopted by the Bank of Japan (BoJ), which is the only central bank in the world to maintain a negative benchmark interest rate, and suggests that the path of least resistance for the USD/JPY pair remains to the upside.
It is worth recalling that the BoJ took steps in July to make the Yield Curve Control (YCC) policy more flexible and allow yield on the 10-year Japanese government bond to move up toward 1% has failed to lend support to the domestic currency. Policymakers, however, have stressed that the policy adjustment was a technical tweak aimed at extending the shelf life of stimulus. Moreover, weaker Japanese wage data reaffirmed bets that the BoJ will maintain ultra-low interest rates.
Bullish traders, however, remain on guard in the wake of expectations for jawboning/intervention by Japanese authorities. This, in turn, warrants some caution before positioning for any further appreciating move. The fundamental backdrop, meanwhile, suggests that any meaningful corrective decline might still be seen as a buying opportunity and is more likely to remain cushioned in the absence of any relevant market-moving economic releases, either from Japan or the US on Monday.
Technical Levels: Supports and Resistances
USDJPY currently trading at 145.1 at the time of writing. Pair opened at 144.96 and is trading with a change of 0.1 % .
| Overview | Overview.1 | |
|---|---|---|
| 0 | Today last price | 145.10 |
| 1 | Today Daily Change | 0.14 |
| 2 | Today Daily Change % | 0.10 |
| 3 | Today daily open | 144.96 |
The pair remains strongly bullish on the daily timeframe. It trades above its 20 SMA @ 141.75, 50 SMA 141.7, 100 SMA @ 138.51 and 200 SMA @ 136.48.
| Trends | Trends.1 | |
|---|---|---|
| 0 | Daily SMA20 | 141.75 |
| 1 | Daily SMA50 | 141.70 |
| 2 | Daily SMA100 | 138.51 |
| 3 | Daily SMA200 | 136.48 |
The previous day high was 145.0 while the previous day low was 144.42. The daily 38.2% Fib levels comes at 144.78, expected to provide support. Similarly, the daily 61.8% fib level is at 144.64, expected to provide support.
Note the levels of interest below:
- Pivot support is noted at 144.59, 144.21, 144.01
- Pivot resistance is noted at 145.17, 145.38, 145.75
| Levels | Levels.1 |
|---|---|
| Previous Daily High | 145.00 |
| Previous Daily Low | 144.42 |
| Previous Weekly High | 145.00 |
| Previous Weekly Low | 141.51 |
| Previous Monthly High | 144.91 |
| Previous Monthly Low | 137.24 |
| Daily Fibonacci 38.2% | 144.78 |
| Daily Fibonacci 61.8% | 144.64 |
| Daily Pivot Point S1 | 144.59 |
| Daily Pivot Point S2 | 144.21 |
| Daily Pivot Point S3 | 144.01 |
| Daily Pivot Point R1 | 145.17 |
| Daily Pivot Point R2 | 145.38 |
| Daily Pivot Point R3 | 145.75 |
[/s2If]
Download Nehcap EAWe have two EAs that are operational on our LIVE accounts.
- EA-FIX: Check out the details here. Download EA-FIX . EA-FIX is a non-grid HFT scalper.
- EA-GROWTH: High quality low dd EA using trend grids. Download EA_GROWTHJoin Our Telegram Group
")


