The US Dollar strengthens as Treasury yields rise after the US Producer Price Index (PPI) exceeds expectations.
…
This is a premium post.
[s2If !current_user_can(access_s2member_level4)]Please register for FREE REGISTER to read full post below containing analysis. In case of any error or you think you are not able to read the full post below, please email us at support#nehcap.com [lwa][/s2If] [s2If current_user_can(access_s2member_level1)]
- US Producer Price Index (PPI) surpasses estimates, bolstering the US Dollar as Treasury yields soar.
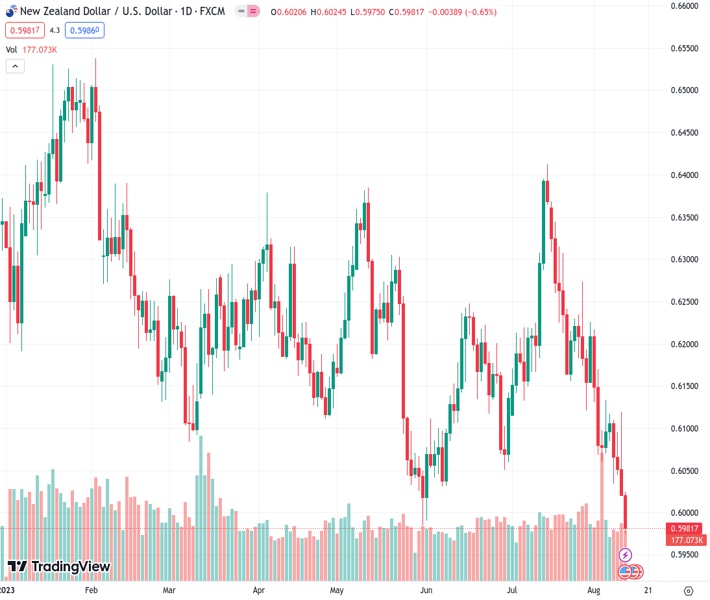
The pair currently trades last at 0.59835.
The previous day high was 0.6118 while the previous day low was 0.602. The daily 38.2% Fib levels comes at 0.6058, expected to provide resistance. Similarly, the daily 61.8% fib level is at 0.6081, expected to provide resistance.
NZD/USD plunges below 0.6000, set to finish the week with losses of 1.86% after inflation data in the United States (US), although mixed, weighed on the NZD/USD pair. Furthermore, the Reserve Bank of New Zealand (RBNZ) adopting a dovish stance was the last nail in the coffin for the Kiwi dollar (NZD). The NZD/USD exchanges hands at 0.5981, down 0.65%.
During the week, the NZD/USD extended its losses courtesy of fundamental news, with US inflation data in the spotlight. Data was mixed, with consumer inflation ticking a little up, but stood below estimates, confirming US disinflationary process. Still, not everything was positive news, as factory prices, known as the Producer Price Index (PPI) for July, exceeded estimates and the prior’s month data. Hence, traders bought the US Dollar (USD) underpinned by soaring US Treasury bond yields, to the detriment of the New Zealand Dollar (NZD).
US Treasury bond yields advanced sharply as traders turned nervous after the data reignited fears of price pressures, which could influence the US Federal Reserve (Fed) to tighten monetary conditions. The US 10-year yields rose nine basis points to 4.168%, while the most sensitive to interest rates, the US 2-year yield, climbed nine basis points to 4.90%.
Consequently, the US Dollar Index (DXY), which measures the buck’s performance vs. its peers, advances 0.32%, at 102.853, printed solid gains during the week.
On the New Zealand (NZ) front, weakness in business activity weighed on the NZD. Worth mentioning that a Reuters poll said that most analysts estimate the Reserve Bank of New Zealand (RBNZ) will keep rates unchanged at 5.50%, at a 14-year high, for the second straight meeting, on August 16. Only two of 29 analysts said that rates would need to rise to 5.75%.
Given the backdrop, the NZD/USD could extend its downtrend, favored by the RBNZ’z stance. If US economic data becomes weaker than expected and the RBNZ surprises the market with a rate hike, the NZD/USD could reclaim the 0.6000 figure. Otherwise, look for a break below 0.5900, with sellers eyeing last year’s October lows of 0.5512.
From a technical perspective, the NZD/USD is set to extend its losses, as the weekly chart portrays a ‘broadening formation’, suggesting that further downside is expected. The break of the pair below the 50-week moving average accelerated the NZD/USD’s fall, and a daily close below the May 2023 lows of 0.5985 could put into play a fall towards the bottom of the ‘broadening formation’ at around 0.5875/0.5900. A drop below that level would put last year’s October low at 0.5512 in play.
Technical Levels: Supports and Resistances
NZDUSD currently trading at 0.5984 at the time of writing. Pair opened at 0.6021 and is trading with a change of -0.61 % .
| Overview | Overview.1 | |
|---|---|---|
| 0 | Today last price | 0.5984 |
| 1 | Today Daily Change | -0.0037 |
| 2 | Today Daily Change % | -0.6100 |
| 3 | Today daily open | 0.6021 |
The pair remains strongly bearish on the daily time frame. It trades below the 20 SMA @ 0.6172, 50 SMA 0.6166, 100 SMA @ 0.6186 and 200 SMA @ 0.6233.
| Trends | Trends.1 | |
|---|---|---|
| 0 | Daily SMA20 | 0.6172 |
| 1 | Daily SMA50 | 0.6166 |
| 2 | Daily SMA100 | 0.6186 |
| 3 | Daily SMA200 | 0.6233 |
The previous day high was 0.6118 while the previous day low was 0.602. The daily 38.2% Fib levels comes at 0.6058, expected to provide resistance. Similarly, the daily 61.8% fib level is at 0.6081, expected to provide resistance.
Note the levels of interest below:
- Pivot support is noted at 0.5988, 0.5955, 0.589
- Pivot resistance is noted at 0.6086, 0.6152, 0.6185
| Levels | Levels.1 |
|---|---|
| Previous Daily High | 0.6118 |
| Previous Daily Low | 0.6020 |
| Previous Weekly High | 0.6226 |
| Previous Weekly Low | 0.6060 |
| Previous Monthly High | 0.6413 |
| Previous Monthly Low | 0.6120 |
| Daily Fibonacci 38.2% | 0.6058 |
| Daily Fibonacci 61.8% | 0.6081 |
| Daily Pivot Point S1 | 0.5988 |
| Daily Pivot Point S2 | 0.5955 |
| Daily Pivot Point S3 | 0.5890 |
| Daily Pivot Point R1 | 0.6086 |
| Daily Pivot Point R2 | 0.6152 |
| Daily Pivot Point R3 | 0.6185 |
[/s2If]
Download Nehcap EAWe have two EAs that are operational on our LIVE accounts.
- EA-FIX: Check out the details here. Download EA-FIX . EA-FIX is a non-grid HFT scalper.
- EA-GROWTH: High quality low dd EA using trend grids. Download EA_GROWTHJoin Our Telegram Group
")


