The US Producer Price Index (PPI), which is higher than it was in June, is causing a brief increase in the value of the US dollar against the British pound, leading to a dip in the GBPUSD exchange rate.
…
This is a premium post.
[s2If !current_user_can(access_s2member_level4)]Please register for FREE REGISTER to read full post below containing analysis. In case of any error or you think you are not able to read the full post below, please email us at support#nehcap.com [lwa][/s2If] [s2If current_user_can(access_s2member_level1)]
- US Producer Price Index (PPI) outpaces June, driving a temporary Greenback rally and GBP/USD dip.
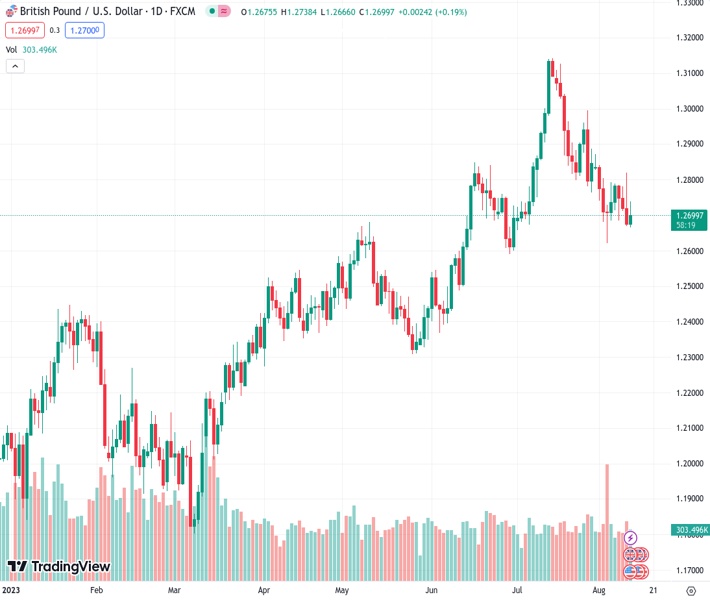
The pair currently trades last at 1.26984.
The previous day high was 1.2819 while the previous day low was 1.267. The daily 38.2% Fib levels comes at 1.2727, expected to provide resistance. Similarly, the daily 61.8% fib level is at 1.2762, expected to provide resistance.
Late in the New York session, the Pound Sterling (GBP) continued to hold its ground against the US Dollar (USD) after UK’s economy grew more than expected, despite US elevated inflation on the producer side. Hence, the GBP/USD trades at 1.2697, gaining 0.16%.
Wall Street is set to finish the session with losses after the United States (US) inflation data posted mixed results. Consumers’ inflation climbed above the prior’s month but below estimates, sparking speculations on the Federal Reserve (Fed) ending its tightening cycle, but data on Friday changed investors’ minds.
The US Department of Labor showed the prices paid by producers, known as the Producer Price Index (PPI), exceeded June’s readings, spurring a Greenback rally; consequently, the GBP/USD weakened.
The University of Michigan Consumer Sentiment poll, revealed that US consumer sentiment slightly deteriorated. Still, Americans remained positive on inflation lowering after the US Federal Reserve (Fed) increased 525 bps its borrowing costs, with inflation expected to dive below 3% on a five-year horizon.
Across the Atlantic, UK’s economy surprisingly grew above estimates, justifying the Bank of England’s (BoE) need to raise rates amidst stubbornly high inflation. Nevertheless, next week’s inflation data can lend a lifeline to the BoE if it shows signs of slowing down as the UK’s economy is still at the brisk of a recession.
The GBP/USD breaking to a new weekly high, above 1.2800 but reversing its gains on soft US inflation data, has exacerbated GBP/USD’s pullback, extending beneath the 1.2700 figure. If GBP/USD remains below the latter and achieves a daily close, that would cement Sterling’s (GBP) faith. That said, the GBP/USD first support would emerge at 1.2666, followed by the August 3 daily low of 1.2620, ahead of sliding towards 1.2500. Conversely, if GBP/USD’s buyers reclaim 1.2700, it would be cheered by buyers, which could remain hopeful of targeting 1.2800, ahead of challenging the July 27 daily high at 1.2995.
Technical Levels: Supports and Resistances
GBPUSD currently trading at 1.2695 at the time of writing. Pair opened at 1.2676 and is trading with a change of 0.15 % .
| Overview | Overview.1 | |
|---|---|---|
| 0 | Today last price | 1.2695 |
| 1 | Today Daily Change | 0.0019 |
| 2 | Today Daily Change % | 0.1500 |
| 3 | Today daily open | 1.2676 |
The pair is trading below its 20 Daily moving average @ 1.2844, below its 50 Daily moving average @ 1.276 , above its 100 Daily moving average @ 1.2604 and above its 200 Daily moving average @ 1.2344
| Trends | Trends.1 | |
|---|---|---|
| 0 | Daily SMA20 | 1.2844 |
| 1 | Daily SMA50 | 1.2760 |
| 2 | Daily SMA100 | 1.2604 |
| 3 | Daily SMA200 | 1.2344 |
The previous day high was 1.2819 while the previous day low was 1.267. The daily 38.2% Fib levels comes at 1.2727, expected to provide resistance. Similarly, the daily 61.8% fib level is at 1.2762, expected to provide resistance.
Note the levels of interest below:
- Pivot support is noted at 1.2624, 1.2573, 1.2475
- Pivot resistance is noted at 1.2773, 1.2871, 1.2922
| Levels | Levels.1 |
|---|---|
| Previous Daily High | 1.2819 |
| Previous Daily Low | 1.2670 |
| Previous Weekly High | 1.2873 |
| Previous Weekly Low | 1.2621 |
| Previous Monthly High | 1.3142 |
| Previous Monthly Low | 1.2659 |
| Daily Fibonacci 38.2% | 1.2727 |
| Daily Fibonacci 61.8% | 1.2762 |
| Daily Pivot Point S1 | 1.2624 |
| Daily Pivot Point S2 | 1.2573 |
| Daily Pivot Point S3 | 1.2475 |
| Daily Pivot Point R1 | 1.2773 |
| Daily Pivot Point R2 | 1.2871 |
| Daily Pivot Point R3 | 1.2922 |
[/s2If]
Download Nehcap EAWe have two EAs that are operational on our LIVE accounts.
- EA-FIX: Check out the details here. Download EA-FIX . EA-FIX is a non-grid HFT scalper.
- EA-GROWTH: High quality low dd EA using trend grids. Download EA_GROWTHJoin Our Telegram Group
")


