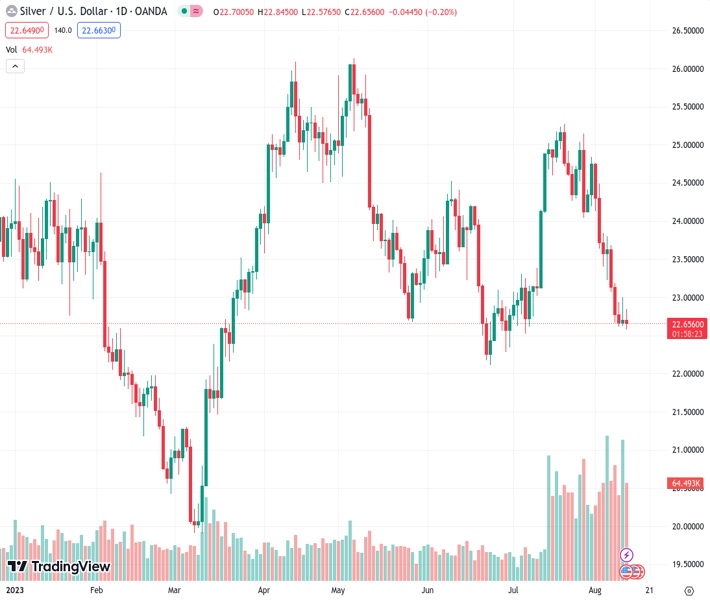
XAGUSD dropped below the price level of $22.70 and is likely to experience a decline of 3.8% for the week.
…
This is a premium post.
[s2If !current_user_can(access_s2member_level4)]Please register for FREE REGISTER to read full post below containing analysis. In case of any error or you think you are not able to read the full post below, please email us at support#nehcap.com [lwa][/s2If] [s2If current_user_can(access_s2member_level1)]
- XAG/USD fell below $22.70 and is poised for a 3.8% weekly loss.
The pair currently trades last at 22.661.
The previous day high was 23.0 while the previous day low was 22.63. The daily 38.2% Fib levels comes at 22.86, expected to provide resistance. Similarly, the daily 61.8% fib level is at 22.77, expected to provide resistance.
On Friday, the XAG/USD saw mild losses and will post its fourth consecutive weekly loss, having lost more than 7% since mid-July. At the end of the week, the US reported hot Producer Price Index (PPI) data and positive University of Michigan (UoM) Sentiment and inflation expectations, which fueled a rise in US bond yields.
After the release of key inflation data throughout the week, American rates are rising. The 10-year bond yield reached 4.16%, up by 1.34%. The 2-year yield stands at 4.89% with a 1% increase, while the 5-year yield is at 4.30% with 1.75 % gains. It’s worth noting that American yields tend to be negatively correlated with non-yielding precious metals, so they may limit the XAG/USD’s upside for the rest of the session.
Overall, inflation saw this week the headline and core Consumer Price Index (CPI) coming lower than expected in July, while the PPI rose to 2.4% higher than expectations. The pace for the metal and bond markets in the next session will be determined by the market’s assessments of the economic situation in the US and how it will affect the next Federal Reserve (Fed) decisions. As for now, the stronger case is that more hikes will be seen in this tightening cycle, but as Jerome Powell stated, it will all depend on the incoming data.
The technical analysis of the daily chart points to a neutral to a bearish outlook for XAG/USD, indicating the potential for further bearish movement. The Relative Strength Index (RSI) displays a flat slope below the 50 middle points, while the Moving Average Convergence (MACD) lays out weaker red bars. Furthermore, the pair is below the 20,100 and 200-day Simple Moving Averages (SMAs), highlighting the continued dominance of bears on the broader scale, requiring the buyers to take action. Traders should eye the 20 and 100-day averages as they are about to perform a bearish cross which could exacerbate the downside in the near term.
Support levels: $22.50, $22.30, $22.00.
Resistance levels: $23.25 (200-day SMA), $23.50, $23.70, $24.05 (a bearish cross between the 20 and 100-day SMA).
Technical Levels: Supports and Resistances
XAGUSD currently trading at 22.66 at the time of writing. Pair opened at 22.71 and is trading with a change of -0.22 % .
| Overview | Overview.1 | |
|---|---|---|
| 0 | Today last price | 22.66 |
| 1 | Today Daily Change | -0.05 |
| 2 | Today Daily Change % | -0.22 |
| 3 | Today daily open | 22.71 |
The pair remains strongly bearish on the daily time frame. It trades below the 20 SMA @ 24.15, 50 SMA 23.68, 100 SMA @ 24.06 and 200 SMA @ 23.24.
| Trends | Trends.1 | |
|---|---|---|
| 0 | Daily SMA20 | 24.15 |
| 1 | Daily SMA50 | 23.68 |
| 2 | Daily SMA100 | 24.06 |
| 3 | Daily SMA200 | 23.24 |
The previous day high was 23.0 while the previous day low was 22.63. The daily 38.2% Fib levels comes at 22.86, expected to provide resistance. Similarly, the daily 61.8% fib level is at 22.77, expected to provide resistance.
Note the levels of interest below:
- Pivot support is noted at 22.56, 22.4, 22.18
- Pivot resistance is noted at 22.93, 23.15, 23.3
| Levels | Levels.1 |
|---|---|
| Previous Daily High | 23.00 |
| Previous Daily Low | 22.63 |
| Previous Weekly High | 24.84 |
| Previous Weekly Low | 23.23 |
| Previous Monthly High | 25.27 |
| Previous Monthly Low | 22.52 |
| Daily Fibonacci 38.2% | 22.86 |
| Daily Fibonacci 61.8% | 22.77 |
| Daily Pivot Point S1 | 22.56 |
| Daily Pivot Point S2 | 22.40 |
| Daily Pivot Point S3 | 22.18 |
| Daily Pivot Point R1 | 22.93 |
| Daily Pivot Point R2 | 23.15 |
| Daily Pivot Point R3 | 23.30 |
[/s2If]
Download Nehcap EAWe have two EAs that are operational on our LIVE accounts.
- EA-FIX: Check out the details here. Download EA-FIX . EA-FIX is a non-grid HFT scalper.
- EA-GROWTH: High quality low dd EA using trend grids. Download EA_GROWTHJoin Our Telegram Group
")


