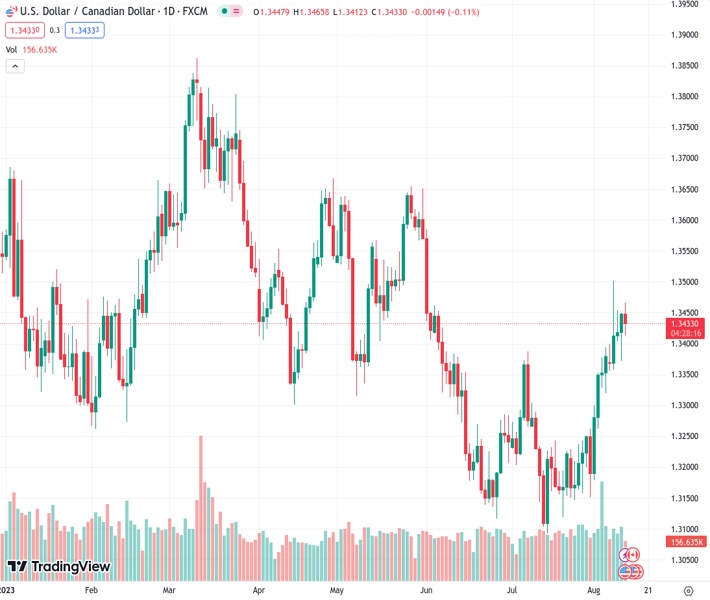
The USDCAD pair, currently at 1.34366, experienced a rejection by the 200-day SMA and subsequently fell near the 1.3420 level. However, it is still expected to achieve a weekly increase.
…
This is a premium post.
[s2If !current_user_can(access_s2member_level4)]Please register for FREE REGISTER to read full post below containing analysis. In case of any error or you think you are not able to read the full post below, please email us at support#nehcap.com [lwa][/s2If] [s2If current_user_can(access_s2member_level1)]
- USD/CAD bulls got rejected at the 200-day SMA and retreated near the 1.3420 area, still poised for a weekly gain
The pair currently trades last at 1.34366.
The previous day high was 1.345 while the previous day low was 1.3373. The daily 38.2% Fib levels comes at 1.3421, expected to provide support. Similarly, the daily 61.8% fib level is at 1.3402, expected to provide support.
At the end of the week, the USD/CAD was rejected by the 200-day Simple Moving Average (SMA) at 1.3450 and settled near 1.3430. On the one hand, the USD is trading mildly stronger after hot Producer Price Index (PPI) from July figures which fueled a rise in American bond yields, while the CAD got a boost on the back of rising Oil prices.
US Producer Price Index from July came in higher than expected. The headline figure rose by 0.3% MoM to 0.8% YoY while the core measure advanced 0.3% MoM vs 0.2% expected to a yearly measure of 2.4%.
As a reaction, the US bond yields are seeing gains across the curve. The 10-year bond yield rose to 4.13%, while the 2-year yield stands at 4.87% and the 5-year yielding 4.25%, respectively. In that sense, higher yields can be attributed to investors placing higher bets on a 25 basis point (bps) hike in November’s Federal Reserve (Fed) meeting. As for now, and according to the CME FedWatch tool, those odds stand at 64% in favour of a no hike and nearly 30% in favour of a hike, vs last week’s 25%. For the September meeting, the stronger case continues to be the Fed not hiking.
Other data released by the US by the University of Michigan indicated that its Sentiment index rose to 71.2, better than the 71 expected, while 5-year Consumer Inflation Expectations dropped to 2.9%.
On the other hand, Oil prices resumed their upwards path and as it is one of Canada’s main exports, higher energy prices strengthened the CAD. Data-wise, nothing relevant will be released on Friday for the Canadian economy.
Analysing the daily chart, indicators point at a neutral to the bearish technical outlook for the USD/CAD, suggesting that the bulls are starting to give up. The Relative Strength Index (RSI) points downwards in the bullish territory, suggesting a possible trend reversal, while the Moving Average Convergence (MACD) prints lower green bars. On the weekly chart, the bullish outlook is more evident as the pair will record its fourth-consecutive weekly gain at the end of this session.
Support levels: 1.3350 (100-day SMA),1.3350, 1.3300.
Resistance levels: 1.3450 (200-day SMA), 1.3500,1.3550.
Technical Levels: Supports and Resistances
USDCAD currently trading at 1.3438 at the time of writing. Pair opened at 1.3449 and is trading with a change of -0.08 % .
| Overview | Overview.1 | |
|---|---|---|
| 0 | Today last price | 1.3438 |
| 1 | Today Daily Change | -0.0011 |
| 2 | Today Daily Change % | -0.0800 |
| 3 | Today daily open | 1.3449 |
The pair is trading above its 20 Daily moving average @ 1.3269, above its 50 Daily moving average @ 1.3268 , above its 100 Daily moving average @ 1.3391 and below its 200 Daily moving average @ 1.3451
| Trends | Trends.1 | |
|---|---|---|
| 0 | Daily SMA20 | 1.3269 |
| 1 | Daily SMA50 | 1.3268 |
| 2 | Daily SMA100 | 1.3391 |
| 3 | Daily SMA200 | 1.3451 |
The previous day high was 1.345 while the previous day low was 1.3373. The daily 38.2% Fib levels comes at 1.3421, expected to provide support. Similarly, the daily 61.8% fib level is at 1.3402, expected to provide support.
Note the levels of interest below:
- Pivot support is noted at 1.3398, 1.3346, 1.332
- Pivot resistance is noted at 1.3475, 1.3502, 1.3553
| Levels | Levels.1 |
|---|---|
| Previous Daily High | 1.3450 |
| Previous Daily Low | 1.3373 |
| Previous Weekly High | 1.3394 |
| Previous Weekly Low | 1.3151 |
| Previous Monthly High | 1.3387 |
| Previous Monthly Low | 1.3093 |
| Daily Fibonacci 38.2% | 1.3421 |
| Daily Fibonacci 61.8% | 1.3402 |
| Daily Pivot Point S1 | 1.3398 |
| Daily Pivot Point S2 | 1.3346 |
| Daily Pivot Point S3 | 1.3320 |
| Daily Pivot Point R1 | 1.3475 |
| Daily Pivot Point R2 | 1.3502 |
| Daily Pivot Point R3 | 1.3553 |
[/s2If]
Download Nehcap EAWe have two EAs that are operational on our LIVE accounts.
- EA-FIX: Check out the details here. Download EA-FIX . EA-FIX is a non-grid HFT scalper.
- EA-GROWTH: High quality low dd EA using trend grids. Download EA_GROWTHJoin Our Telegram Group
")


