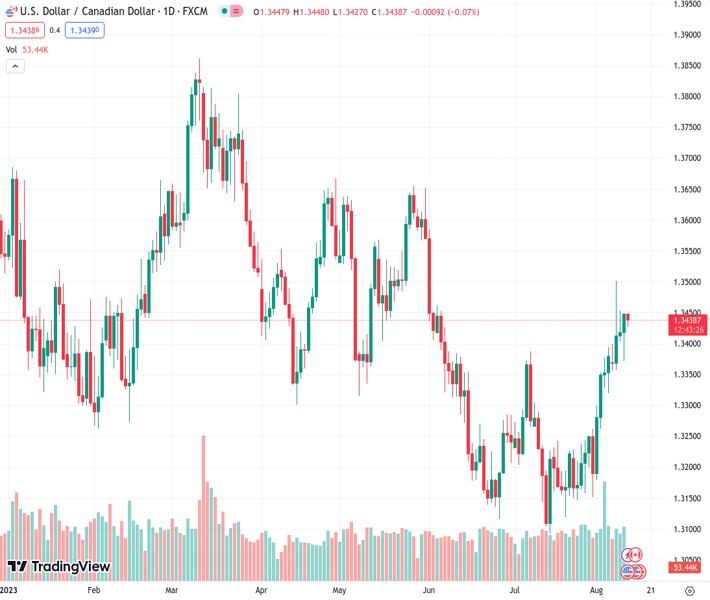
The USDCAD currency pair is trading at 1.34400 with a slight downward trend on Friday, but there is a lack of sustained selling pressure.
…
This is a premium post.
[s2If !current_user_can(access_s2member_level4)]Please register for FREE REGISTER to read full post below containing analysis. In case of any error or you think you are not able to read the full post below, please email us at support#nehcap.com [lwa][/s2If] [s2If current_user_can(access_s2member_level1)]
- USD/CAD trades with a mild negative bias on Friday, albeit lacks follow-through selling.
The pair currently trades last at 1.34400.
The previous day high was 1.345 while the previous day low was 1.3373. The daily 38.2% Fib levels comes at 1.3421, expected to provide support. Similarly, the daily 61.8% fib level is at 1.3402, expected to provide support.
The USD/CAD pair edges lower on the last day of the week and remains on the defensive through the early European session, though lacks follow-through selling. Spot prices currently trade around the 1.3435 region, down less than 0.10% for the day, and seem poised to build on the recent goodish recovery move from the YTD low touched in July.
The US Dollar (USD) struggles to capitalize on the previous day’s solid rebound from over a one-week low – touched in reaction to the softer US consumer inflation figures – and turns out to be a key factor acting as a headwind for the USD/CAD pair. The US Bureau of Labor Statistics (BLS) reported on Thursday that the headline CPI rose from 3% to the 3.2% YoY rate in July, less than consensus estimates, while the Core CPI (excluding volatile food and energy prices) edged lower to 4.7% from 4.8% in June. The data ensures that the Federal Reserve (Fed) will not hike its benchmark overnight interest rate at the September 19-20 meeting and prompts some USD selling.
The inflation, however, remains way above the central bank’s 2% target, which, along with hawkish remarks by San Francisco Fed President Mary Daly, keeps the door wide open for one more 25 bps lift-of by the end of this year. In fact, Daly said that the inflation data is moving in the right direction, though the core inflation hasn’t made much progress. She added that it would be premature to project whether the Fed raises another time, or holds rates steady for a longer period, as there is a lot of information coming in between now and the next meeting. This leads to a further rise in the US Treasury bond yields and should help limit any further losses for the buck.
Apart from this, the worsening economic conditions in China support prospects for the emergence of some dip-buying around the safe-haven Greenback. This, along with subdued Crude Oil prices and growing acceptance that the Bank of Canada (BoC) will pause its interest rate hike campaign, could undermine the commodity-linked Loonie and lend support to the USD/CAD pair. Investors now look to the US economic docket, featuring the release of the Producer Price Index (PPI), along with the Preliminary Michigan Consumer Sentiment and Inflation Expectations, which might influence the USD. Traders will further take cues from Oil price dynamics to grab short-term opportunities.
Technical Levels: Supports and Resistances
USDCAD currently trading at 1.3435 at the time of writing. Pair opened at 1.3449 and is trading with a change of -0.1 % .
| Overview | Overview.1 | |
|---|---|---|
| 0 | Today last price | 1.3435 |
| 1 | Today Daily Change | -0.0014 |
| 2 | Today Daily Change % | -0.1000 |
| 3 | Today daily open | 1.3449 |
The pair is trading above its 20 Daily moving average @ 1.3269, above its 50 Daily moving average @ 1.3268 , above its 100 Daily moving average @ 1.3391 and below its 200 Daily moving average @ 1.3451
| Trends | Trends.1 | |
|---|---|---|
| 0 | Daily SMA20 | 1.3269 |
| 1 | Daily SMA50 | 1.3268 |
| 2 | Daily SMA100 | 1.3391 |
| 3 | Daily SMA200 | 1.3451 |
The previous day high was 1.345 while the previous day low was 1.3373. The daily 38.2% Fib levels comes at 1.3421, expected to provide support. Similarly, the daily 61.8% fib level is at 1.3402, expected to provide support.
Note the levels of interest below:
- Pivot support is noted at 1.3398, 1.3346, 1.332
- Pivot resistance is noted at 1.3475, 1.3502, 1.3553
| Levels | Levels.1 |
|---|---|
| Previous Daily High | 1.3450 |
| Previous Daily Low | 1.3373 |
| Previous Weekly High | 1.3394 |
| Previous Weekly Low | 1.3151 |
| Previous Monthly High | 1.3387 |
| Previous Monthly Low | 1.3093 |
| Daily Fibonacci 38.2% | 1.3421 |
| Daily Fibonacci 61.8% | 1.3402 |
| Daily Pivot Point S1 | 1.3398 |
| Daily Pivot Point S2 | 1.3346 |
| Daily Pivot Point S3 | 1.3320 |
| Daily Pivot Point R1 | 1.3475 |
| Daily Pivot Point R2 | 1.3502 |
| Daily Pivot Point R3 | 1.3553 |
[/s2If]
Download Nehcap EAWe have two EAs that are operational on our LIVE accounts.
- EA-FIX: Check out the details here. Download EA-FIX . EA-FIX is a non-grid HFT scalper.
- EA-GROWTH: High quality low dd EA using trend grids. Download EA_GROWTHJoin Our Telegram Group
")


