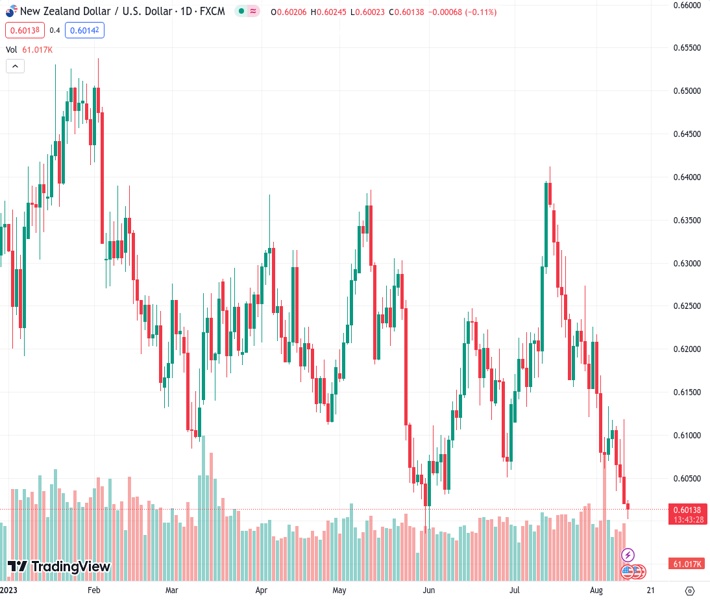
The NZDUSD pair at a rate of 0.60127 continues to face downward pressure and manages to find some support just above the 0.6000 level on Friday.
…
This is a premium post.
[s2If !current_user_can(access_s2member_level4)]Please register for FREE REGISTER to read full post below containing analysis. In case of any error or you think you are not able to read the full post below, please email us at support#nehcap.com [lwa][/s2If] [s2If current_user_can(access_s2member_level1)]
- NZD/USD remains under pressure and finds support above the 0.6000 area on Friday.
The pair currently trades last at 0.60127.
The previous day high was 0.6118 while the previous day low was 0.602. The daily 38.2% Fib levels comes at 0.6058, expected to provide resistance. Similarly, the daily 61.8% fib level is at 0.6081, expected to provide resistance.
The NZD/USD pair attracts some sellers and edges lower to 0.6012, near the multi-month low heading into the early Asian session on Friday. Markets turn cautious ahead of the release of top-tier US data in the American session. The data could trigger volatility in NZD/USD later in the day.
The US Bureau of Labor Statistics (BLS) reported on Thursday that the US Consumer Price Index (CPI) rose to 3.2% YoY from 3% in June. The figure was below the market consensus of 3.3%. While the Core CPI figure, which excludes volatile food and energy prices, fell to 4.7% from 4.8%. Additionally, the US Initial Jobless Claims increased to 248,000, above the expectation of 230,000. In response to the data, the US Dollar reversed its course and strengthened against its rivals.
Apart from this, the Fed San Francisco President, Mary C. Daly, stated on Thursday that there is a lot more information to evaluate and that it is premature to project whether additional rate increases or a prolonged period of holding rates are required. This, in turn, caps the upside for the Kiwi and acts as a headwind for the NZD/USD pair.
On the Kiwi front, the New Zealand Inflation Expectations QoQ came in at 2.83% versus 2.79% prior. While the Business NZ PMI fell to 46.3 versus 49.4 expected. The majority of analysts, according to a recent Reuters poll, anticipate that the Reserve Bank of New Zealand (RBNZ) will maintain rates at 5.50%, a 14-year high, for the second consecutive meeting on August 16.
Meanwhile,the exacerbated trade war tensions between the US and China might exert pressure on the Kiwi, the proxy currency for the Chinese economy. That said, US President Joe Biden issued an executive order on Wednesday prohibiting new US investments in China in sensitive technologies. The US government intends to target only Chinese companies that generate more than 50% of their revenue from quantum computation and artificial intelligence (AI). However, the restrictions would apply to “narrow subsets” of the three domains, but the administration did not provide further details, and the proposal is available for public comment.
Looking ahead, market participants will closely watch the US Producer Price Index (PPI), due later in the day. The figure is expected to rise from 0.1% to 0.7% YoY. Also, the University of Michigan (UoM) Consumer Confidence Survey will be due in the American session. The data will be critical for determining a clear movement for the NZD/USD pair.
Technical Levels: Supports and Resistances
NZDUSD currently trading at 0.6009 at the time of writing. Pair opened at 0.6021 and is trading with a change of -0.2 % .
| Overview | Overview.1 | |
|---|---|---|
| 0 | Today last price | 0.6009 |
| 1 | Today Daily Change | -0.0012 |
| 2 | Today Daily Change % | -0.2000 |
| 3 | Today daily open | 0.6021 |
The pair remains strongly bearish on the daily time frame. It trades below the 20 SMA @ 0.6172, 50 SMA 0.6166, 100 SMA @ 0.6186 and 200 SMA @ 0.6233.
| Trends | Trends.1 | |
|---|---|---|
| 0 | Daily SMA20 | 0.6172 |
| 1 | Daily SMA50 | 0.6166 |
| 2 | Daily SMA100 | 0.6186 |
| 3 | Daily SMA200 | 0.6233 |
The previous day high was 0.6118 while the previous day low was 0.602. The daily 38.2% Fib levels comes at 0.6058, expected to provide resistance. Similarly, the daily 61.8% fib level is at 0.6081, expected to provide resistance.
Note the levels of interest below:
- Pivot support is noted at 0.5988, 0.5955, 0.589
- Pivot resistance is noted at 0.6086, 0.6152, 0.6185
| Levels | Levels.1 |
|---|---|
| Previous Daily High | 0.6118 |
| Previous Daily Low | 0.6020 |
| Previous Weekly High | 0.6226 |
| Previous Weekly Low | 0.6060 |
| Previous Monthly High | 0.6413 |
| Previous Monthly Low | 0.6120 |
| Daily Fibonacci 38.2% | 0.6058 |
| Daily Fibonacci 61.8% | 0.6081 |
| Daily Pivot Point S1 | 0.5988 |
| Daily Pivot Point S2 | 0.5955 |
| Daily Pivot Point S3 | 0.5890 |
| Daily Pivot Point R1 | 0.6086 |
| Daily Pivot Point R2 | 0.6152 |
| Daily Pivot Point R3 | 0.6185 |
[/s2If]
Download Nehcap EAWe have two EAs that are operational on our LIVE accounts.
- EA-FIX: Check out the details here. Download EA-FIX . EA-FIX is a non-grid HFT scalper.
- EA-GROWTH: High quality low dd EA using trend grids. Download EA_GROWTHJoin Our Telegram Group
")


