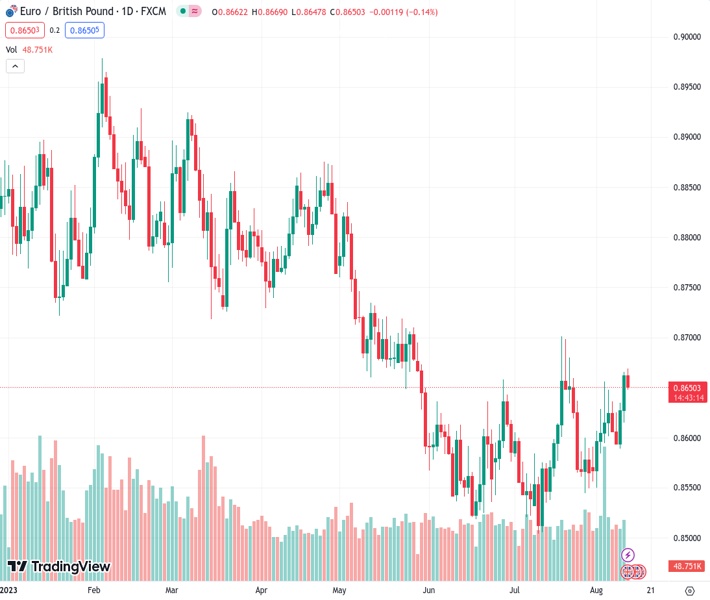
The EURGBP currency pair, which was trading at 0.86499, is experiencing selling pressure and dropping to a new low for the day, after briefly reaching its highest level in three weeks.
…
This is a premium post.
[s2If !current_user_can(access_s2member_level4)]Please register for FREE REGISTER to read full post below containing analysis. In case of any error or you think you are not able to read the full post below, please email us at support#nehcap.com [lwa][/s2If] [s2If current_user_can(access_s2member_level1)]
- EUR/GBP takes offers to refresh intraday low after initially renewing a three-week high.
The pair currently trades last at 0.86499.
The previous day high was 0.8666 while the previous day low was 0.8625. The daily 38.2% Fib levels comes at 0.865, expected to provide resistance. Similarly, the daily 61.8% fib level is at 0.864, expected to provide support.
EUR/GBP drops more than 15 pips as it renews its intraday low near 0.8650 after upbeat UK growth numbers were published early Friday morning in London. Adding strength to the bearish bias could be the fears of the European Central Bank’s (ECB) policy pivot in September, as well as the downbeat ECB report.
As per the preliminary readings of the UK’s second quarter (Q2) Gross Domestic Product (GDP), the British economy grew 0.2% QoQ versus 0.1% prior and 0.0% expected while the monthly GDP also rose by 0.5% MoM in June compared to -0.1% previous readings and 0.2% forecasts.
Also read: Breaking: UK Preliminary GDP expands 0.2% QoQ in Q2 2023 vs. 0% expected
Elsewhere, the European Central Bank’s (ECB) monthly Economic Bulletin unveiled a highly uncertain outlook for the bloc’s economic growth and inflation. The publication also mentioned the continuous decline in the “too high inflation”, as well as deterioration in the near-term economic outlook.
Earlier in the day, the latest Reuters poll about the European Central Bank (ECB) cites the market’s mixed concerns as a slim majority expects a pause to the rate hike trajectory in September but the hot inflation also pushes some economists to expect a rate increase by the year-end. The same also exerts downside pressure on the EUR/GBP pair.
It’s worth noting that the early week forecasts of the UK’s leading thinktank National Institute of Economic and Social Research (NIESR) signaled higher rates and bolstered hawkish bias about the Bank of England (BoE), which in turn weigh on the EUR/GBP price.
Having witnessed the initial market reaction to the UK Q2 GDP data, the EUR/GBP pair traders should look for risk catalysts for clear directions as the economic calendar remains mostly empty for the Eurozone. Even so, recent doubts about the ECB’s future rate hikes may prod the cross-currency pair’s immediate upside.
EUR/GBP bulls need a daily closing beyond the 100-DMA hurdle surrounding 0.8670 to keep the reins while a pullback move remains elusive beyond the previous resistance line stretched from late April, close to 0.8650 at the latest.
Technical Levels: Supports and Resistances
EURGBP currently trading at 0.8666 at the time of writing. Pair opened at 0.8663 and is trading with a change of 0.03% % .
| Overview | Overview.1 | |
|---|---|---|
| 0 | Today last price | 0.8666 |
| 1 | Today Daily Change | 0.0003 |
| 2 | Today Daily Change % | 0.03% |
| 3 | Today daily open | 0.8663 |
The pair is trading above its 20 Daily moving average @ 0.8609, above its 50 Daily moving average @ 0.8587 , below its 100 Daily moving average @ 0.8671 and below its 200 Daily moving average @ 0.8725
| Trends | Trends.1 | |
|---|---|---|
| 0 | Daily SMA20 | 0.8609 |
| 1 | Daily SMA50 | 0.8587 |
| 2 | Daily SMA100 | 0.8671 |
| 3 | Daily SMA200 | 0.8725 |
The previous day high was 0.8666 while the previous day low was 0.8625. The daily 38.2% Fib levels comes at 0.865, expected to provide resistance. Similarly, the daily 61.8% fib level is at 0.864, expected to provide support.
Note the levels of interest below:
- Pivot support is noted at 0.8637, 0.861, 0.8596
- Pivot resistance is noted at 0.8678, 0.8692, 0.8719
| Levels | Levels.1 |
|---|---|
| Previous Daily High | 0.8666 |
| Previous Daily Low | 0.8625 |
| Previous Weekly High | 0.8656 |
| Previous Weekly Low | 0.8550 |
| Previous Monthly High | 0.8701 |
| Previous Monthly Low | 0.8504 |
| Daily Fibonacci 38.2% | 0.8650 |
| Daily Fibonacci 61.8% | 0.8640 |
| Daily Pivot Point S1 | 0.8637 |
| Daily Pivot Point S2 | 0.8610 |
| Daily Pivot Point S3 | 0.8596 |
| Daily Pivot Point R1 | 0.8678 |
| Daily Pivot Point R2 | 0.8692 |
| Daily Pivot Point R3 | 0.8719 |
[/s2If]
Download Nehcap EAWe have two EAs that are operational on our LIVE accounts.
- EA-FIX: Check out the details here. Download EA-FIX . EA-FIX is a non-grid HFT scalper.
- EA-GROWTH: High quality low dd EA using trend grids. Download EA_GROWTHJoin Our Telegram Group
")


