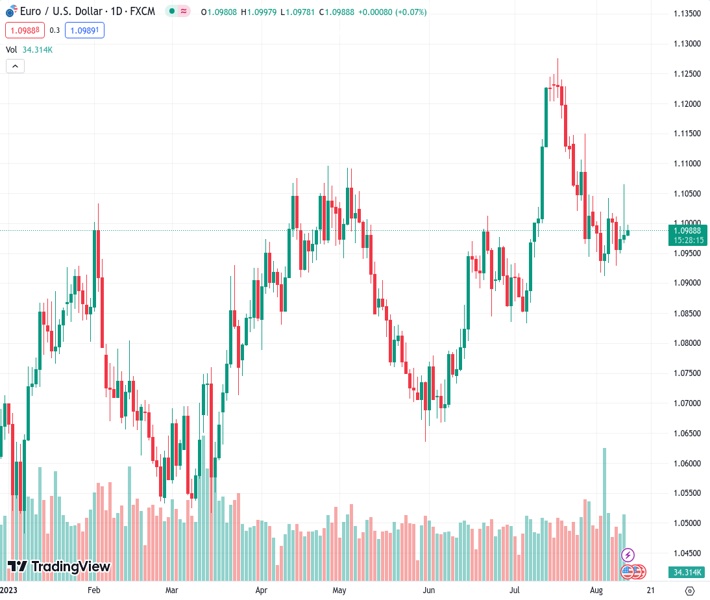
The EURUSD pair is currently trading at 1.09888 and has remained relatively stable around the 1.0985 level. It has gained a slight increase of 0.05% due to investors becoming cautious in anticipation of the upcoming US PPI data.
…
This is a premium post.
[s2If !current_user_can(access_s2member_level4)]Please register for FREE REGISTER to read full post below containing analysis. In case of any error or you think you are not able to read the full post below, please email us at support#nehcap.com [lwa][/s2If] [s2If current_user_can(access_s2member_level1)]
- EUR/USD remains sideways around 1.0985, gaining 0.05% as markets turn cautious ahead of US PPI data.
The pair currently trades last at 1.09888.
The previous day high was 1.1065 while the previous day low was 1.0967. The daily 38.2% Fib levels comes at 1.1028, expected to provide resistance. Similarly, the daily 61.8% fib level is at 1.1005, expected to provide resistance.
The EUR/USD pair holds ground above the 1.0980 mark heading into the early European session on Friday. The major pair trades in positive territory for the third consecutive day after retreating from a weekly high of 1.1065 following US inflation data. Market participants prefer to wait on the sidelines ahead of the US Producer Price Index (PPI), due later in the American session.
The European Central Bank’s (ECB) monthly Economic Bulletin revealed on Thursday that the Eurozone’s inflation is still predicted to be too high for too long, and the prospects for economic growth and inflation are still uncertain. According to the Reuters poll, the target inflation rate of 2.0% will not be reached until at least 2025, and more than 90% of economists surveyed anticipate no rate cuts before the second quarter of 2024.
On the US Dollar docket, the US Consumer Price Index (CPI) rose to 3.2% YoY from 3% in June. The figure was below the market consensus of 3.3%. While the Core CPI figure, which excludes volatile food and energy prices, fell to 4.7% from 4.8%. Additionally, the US Initial Jobless Claims increased to 248,000, above the expectation of 230,000. In response to the data, the US Dollar reversed its course and dragged the Euro lower on Thursday.
Apart from this, the Fed San Francisco President, Mary C. Daly, stated on Thursday that there is a lot more information to evaluate and that it is premature to project whether additional rate increases or a prolonged period of holding rates are required. This, in turn, caps the upside for the Euro and acts as a headwind for the EUR/USD pair.
Looking ahead, all eyes are on the highly anticipated US inflation data. The US Producer Price Index (PPI) will be released later in the day. The figure is expected to rise from 0.1% to 0.7% YoY. Also, the University of Michigan (UoM) Consumer Confidence Survey will be due on Friday. Traders anticipate that the data might convince the Federal Reserve (Fed) that it is now under control and no further interest rate increases are necessary. The data will be critical for determining a clear movement for the EUR/USD pair.
Technical Levels: Supports and Resistances
EURUSD currently trading at 1.0988 at the time of writing. Pair opened at 1.0981 and is trading with a change of 0.06 % .
| Overview | Overview.1 | |
|---|---|---|
| 0 | Today last price | 1.0988 |
| 1 | Today Daily Change | 0.0007 |
| 2 | Today Daily Change % | 0.0600 |
| 3 | Today daily open | 1.0981 |
The pair is trading below its 20 Daily moving average @ 1.1057, above its 50 Daily moving average @ 1.0957 , above its 100 Daily moving average @ 1.0928 and above its 200 Daily moving average @ 1.0768
| Trends | Trends.1 | |
|---|---|---|
| 0 | Daily SMA20 | 1.1057 |
| 1 | Daily SMA50 | 1.0957 |
| 2 | Daily SMA100 | 1.0928 |
| 3 | Daily SMA200 | 1.0768 |
The previous day high was 1.1065 while the previous day low was 1.0967. The daily 38.2% Fib levels comes at 1.1028, expected to provide resistance. Similarly, the daily 61.8% fib level is at 1.1005, expected to provide resistance.
Note the levels of interest below:
- Pivot support is noted at 1.0944, 1.0907, 1.0846
- Pivot resistance is noted at 1.1042, 1.1102, 1.114
| Levels | Levels.1 |
|---|---|
| Previous Daily High | 1.1065 |
| Previous Daily Low | 1.0967 |
| Previous Weekly High | 1.1046 |
| Previous Weekly Low | 1.0912 |
| Previous Monthly High | 1.1276 |
| Previous Monthly Low | 1.0834 |
| Daily Fibonacci 38.2% | 1.1028 |
| Daily Fibonacci 61.8% | 1.1005 |
| Daily Pivot Point S1 | 1.0944 |
| Daily Pivot Point S2 | 1.0907 |
| Daily Pivot Point S3 | 1.0846 |
| Daily Pivot Point R1 | 1.1042 |
| Daily Pivot Point R2 | 1.1102 |
| Daily Pivot Point R3 | 1.1140 |
[/s2If]
Download Nehcap EAWe have two EAs that are operational on our LIVE accounts.
- EA-FIX: Check out the details here. Download EA-FIX . EA-FIX is a non-grid HFT scalper.
- EA-GROWTH: High quality low dd EA using trend grids. Download EA_GROWTHJoin Our Telegram Group
")


