The USD to INR exchange rate reached 82.7375 on Friday and encountered new selling pressure due to a slight weakening of the USD.
…
This is a premium post.
[s2If !current_user_can(access_s2member_level4)]Please register for FREE REGISTER to read full post below containing analysis. In case of any error or you think you are not able to read the full post below, please email us at support#nehcap.com [lwa][/s2If] [s2If current_user_can(access_s2member_level1)]
- USD/INR meets with a fresh supply on Friday and is pressured by a modest USD weakness.
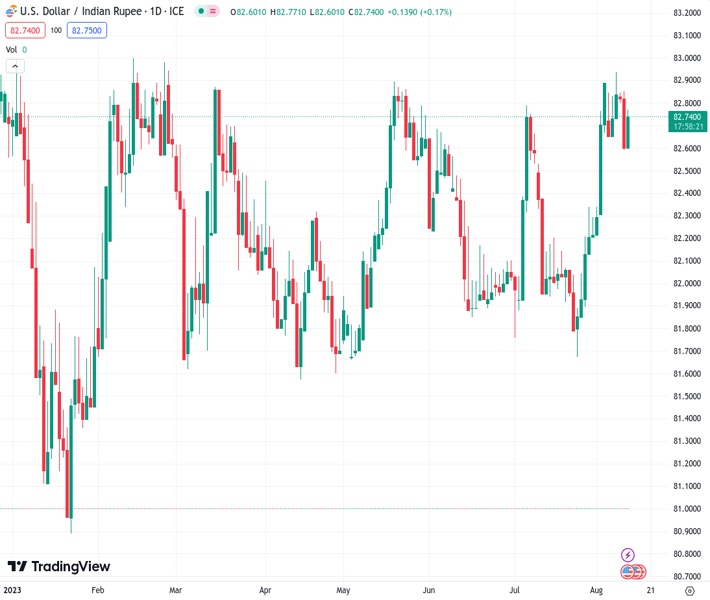
The pair currently trades last at 82.7375.
The previous day high was 82.9232 while the previous day low was 82.5854. The daily 38.2% Fib levels comes at 82.7144, expected to provide support. Similarly, the daily 61.8% fib level is at 82.7941, expected to provide resistance.
The USD/INR pair struggles to capitalize on the overnight solid rebound from the 82.60-82.55 area, or over a one-week low and meets with a fresh supply during the Asian session on Friday. Spot prices currently trade around the 82.75 region, down 0.15% for the day, though remain well within the striking distance of a more than six-month peak touched on Wednesday.
The downtick could be attributed to a modest US Dollar (USD) weakness and some technical selling after this week’s failure to find acceptance above the 83.00 round-figure mark. Looking at the broader picture, the USD/INR pair has been oscillating in a familiar trading range over the past weeks or so. Against the backdrop of the recent rally from the 81.70 area, or the July swing low, this might still be categorized as a bullish consolidation phase.
Adding to this, technical indicators on the daily chart are holding comfortably in the positive territory and suggest that the path of least resistance for the USD/INR pair is to the upside. That said, it will still be prudent to wait for a sustained strength beyond the 83.00 mark before positioning for any further gains. Spot prices might then surpass the all-time peak, around the 83.40-83.45 region touched in October 2023, and aim to conquer the 84.00 mark.
On the flip side, a subsequent decline below the overnight swing low, around the 82.60-82.55 region, could attract fresh buyers near the very important 200-day Simple Moving Average (SMA), around the 82.20 region. This, in turn, should help limit losses for the USD/INR pair near the 82.00 mark. The latter should act as a pivotal point, which if broken decisively might shift the bias in favour of bearish traders and pave the way for a further depreciating move.
The downward trajectory might then drag the USD/INR pair below the 81.75 region, or the July swing low, towards the next relevant support near the 81.50 zone. Spot prices could eventually drop to test sub-81.00 levels or the YTD low touched in January.
Technical Levels: Supports and Resistances
USDINR currently trading at 82.7386 at the time of writing. Pair opened at 82.8705 and is trading with a change of -0.16 % .
| Overview | Overview.1 | |
|---|---|---|
| 0 | Today last price | 82.7386 |
| 1 | Today Daily Change | -0.1319 |
| 2 | Today Daily Change % | -0.1600 |
| 3 | Today daily open | 82.8705 |
The pair remains strongly bullish on the daily timeframe. It trades above its 20 SMA @ 82.3652, 50 SMA 82.2731, 100 SMA @ 82.216 and 200 SMA @ 82.1679.
| Trends | Trends.1 | |
|---|---|---|
| 0 | Daily SMA20 | 82.3652 |
| 1 | Daily SMA50 | 82.2731 |
| 2 | Daily SMA100 | 82.2160 |
| 3 | Daily SMA200 | 82.1679 |
The previous day high was 82.9232 while the previous day low was 82.5854. The daily 38.2% Fib levels comes at 82.7144, expected to provide support. Similarly, the daily 61.8% fib level is at 82.7941, expected to provide resistance.
Note the levels of interest below:
- Pivot support is noted at 82.6629, 82.4552, 82.325
- Pivot resistance is noted at 83.0007, 83.1308, 83.3385
| Levels | Levels.1 |
|---|---|
| Previous Daily High | 82.9232 |
| Previous Daily Low | 82.5854 |
| Previous Weekly High | 82.8996 |
| Previous Weekly Low | 82.2000 |
| Previous Monthly High | 82.8334 |
| Previous Monthly Low | 81.6588 |
| Daily Fibonacci 38.2% | 82.7144 |
| Daily Fibonacci 61.8% | 82.7941 |
| Daily Pivot Point S1 | 82.6629 |
| Daily Pivot Point S2 | 82.4552 |
| Daily Pivot Point S3 | 82.3250 |
| Daily Pivot Point R1 | 83.0007 |
| Daily Pivot Point R2 | 83.1308 |
| Daily Pivot Point R3 | 83.3385 |
[/s2If]
Download Nehcap EAWe have two EAs that are operational on our LIVE accounts.
- EA-FIX: Check out the details here. Download EA-FIX . EA-FIX is a non-grid HFT scalper.
- EA-GROWTH: High quality low dd EA using trend grids. Download EA_GROWTHJoin Our Telegram Group
")


