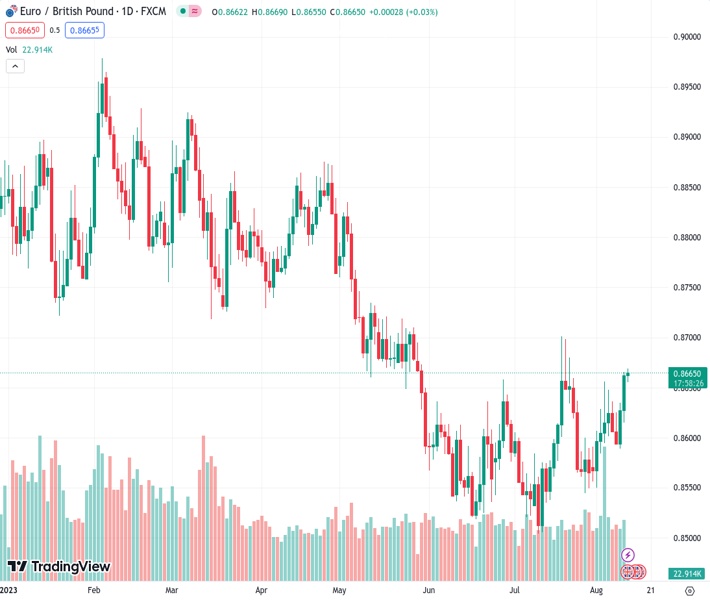
The EURGBP pair, currently trading at 0.86652, is experiencing a gradual increase in momentum for the third consecutive day and reaches its highest level in three weeks.
…
This is a premium post.
[s2If !current_user_can(access_s2member_level4)]Please register for FREE REGISTER to read full post below containing analysis. In case of any error or you think you are not able to read the full post below, please email us at support#nehcap.com [lwa][/s2If] [s2If current_user_can(access_s2member_level1)]
- EUR/GBP gains some positive traction for the third straight day and climbs to a three-week top.
The pair currently trades last at 0.86652.
The previous day high was 0.8666 while the previous day low was 0.8625. The daily 38.2% Fib levels comes at 0.865, expected to provide support. Similarly, the daily 61.8% fib level is at 0.864, expected to provide support.
The EUR/GBP cross touches a three-week high, around the 0.8670 area, during the Asian session on Friday and looks to build on its strong weekly gains registered over the past two days.
Despite the recent surge in European gas prices, the shared currency continues to outperform its British counterpart in the wake of a further rise in German bond yields. Apart from this, a bleak outlook for the UK economy continues to undermine the Sterling Pound and turns out to be another factor acting as a tailwind for the EUR/GBP cross. It is worth recalling that the National Institute of Economic and Social Research (NIESR) said earlier this week that it would take until the third quarter of 2024 for UK output to return to its pre-pandemic peak.
In its quarterly update, the NIESR added that there was a 60% risk of the government going to the polls during a recession. This comes on the back of the Bank of England’s (BoE) less hawkish forward guidance, signalling that the tightening cycle may be nearing an end, and pushes the EUR/GBP cross higher for the third straight day. Traders, however, seem reluctant to place aggressive bullish bets and prefer to wait on the sidelines ahead of the key UK macro data, including the preliminary Q2 GDP report, due for release this Friday.
Any signs of unexpected strength or weakness in the economy will influence expectations about the BoE’s future rate-hike path and impact the British Pound, which has been struggling to gain any meaningful traction, so far, in August. In the meantime, speculations that the European Central Bank (ECB) will halt its streak of nine consecutive rate hikes in September might cap the upside for the EUR/GBP cross. The ECB economic bulletin published last Friday noted that the underlying inflation in the region likely peaked during the first half of 2023.
Apart from this, the worsening economic conditions and mounting recession fears might further contribute to keeping a lid on any meaningful appreciating move for the Euro. Nevertheless, the EUR/GBP cross, at current levels, remains on track to register gains for the second successive week as market participants now look to the UK economic docket to grab short-term trading opportunities.
Technical Levels: Supports and Resistances
EURGBP currently trading at 0.8665 at the time of writing. Pair opened at 0.8663 and is trading with a change of 0.02 % .
| Overview | Overview.1 | |
|---|---|---|
| 0 | Today last price | 0.8665 |
| 1 | Today Daily Change | 0.0002 |
| 2 | Today Daily Change % | 0.0200 |
| 3 | Today daily open | 0.8663 |
The pair is trading above its 20 Daily moving average @ 0.8609, above its 50 Daily moving average @ 0.8587 , below its 100 Daily moving average @ 0.8671 and below its 200 Daily moving average @ 0.8725
| Trends | Trends.1 | |
|---|---|---|
| 0 | Daily SMA20 | 0.8609 |
| 1 | Daily SMA50 | 0.8587 |
| 2 | Daily SMA100 | 0.8671 |
| 3 | Daily SMA200 | 0.8725 |
The previous day high was 0.8666 while the previous day low was 0.8625. The daily 38.2% Fib levels comes at 0.865, expected to provide support. Similarly, the daily 61.8% fib level is at 0.864, expected to provide support.
Note the levels of interest below:
- Pivot support is noted at 0.8637, 0.861, 0.8596
- Pivot resistance is noted at 0.8678, 0.8692, 0.8719
| Levels | Levels.1 |
|---|---|
| Previous Daily High | 0.8666 |
| Previous Daily Low | 0.8625 |
| Previous Weekly High | 0.8656 |
| Previous Weekly Low | 0.8550 |
| Previous Monthly High | 0.8701 |
| Previous Monthly Low | 0.8504 |
| Daily Fibonacci 38.2% | 0.8650 |
| Daily Fibonacci 61.8% | 0.8640 |
| Daily Pivot Point S1 | 0.8637 |
| Daily Pivot Point S2 | 0.8610 |
| Daily Pivot Point S3 | 0.8596 |
| Daily Pivot Point R1 | 0.8678 |
| Daily Pivot Point R2 | 0.8692 |
| Daily Pivot Point R3 | 0.8719 |
[/s2If]
Download Nehcap EAWe have two EAs that are operational on our LIVE accounts.
- EA-FIX: Check out the details here. Download EA-FIX . EA-FIX is a non-grid HFT scalper.
- EA-GROWTH: High quality low dd EA using trend grids. Download EA_GROWTHJoin Our Telegram Group
")


