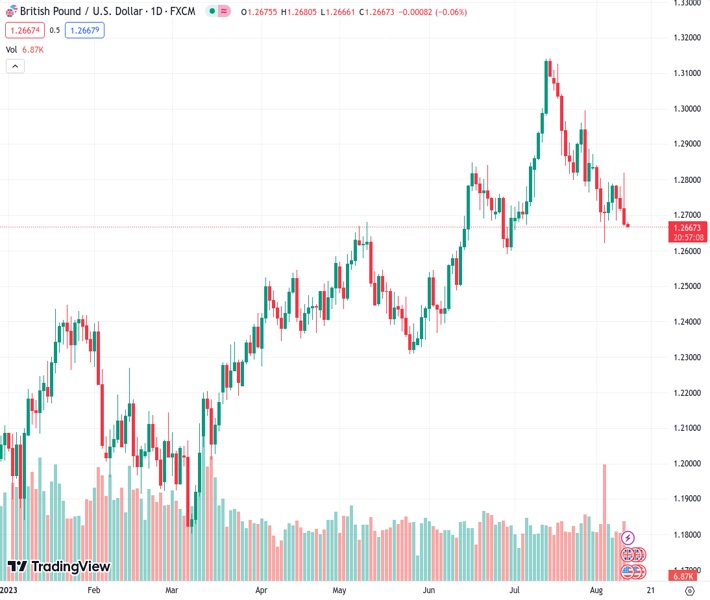
The GBP/USD currency pair remains under pressure, trading within a bearish trend channel that has been in place for three weeks. According to the view of @nehcap, it is anticipated that the pair will experience additional downward movement.
…
This is a premium post.
[s2If !current_user_can(access_s2member_level4)]Please register for FREE REGISTER to read full post below containing analysis. In case of any error or you think you are not able to read the full post below, please email us at support#nehcap.com [lwa][/s2If] [s2If current_user_can(access_s2member_level1)]
- GBP/USD stays pressured within three-week-old bearish trend channel.
The pair currently trades last at 1.26650.
The previous day high was 1.2782 while the previous day low was 1.2712. The daily 38.2% Fib levels comes at 1.2739, expected to provide resistance. Similarly, the daily 61.8% fib level is at 1.2755, expected to provide resistance.
GBP/USD remains on the back foot at the lowest level in a week, pressured near 1.2670 amid the early hours of Friday’s Asian session. In doing so, the Cable pair traders portray the cautious mood within a three-week-old bearish trend channel, despite holding lower grounds after declining in the last three consecutive days.
It’s worth noting that the Pound Sterling trader’s anxiety can be linked to Friday’s scheduled release of the first readings of the UK’s second quarter (Q2) Gross Domestic Product (GDP), expected 0.0% QoQ versus 0.1% prior, especially amid fears of British recession.
Also read: GBP/USD wavers amid US CPI data; traders focus on UK’s GDP
Adding credence to the downside bias are the bearish MACD signals. However, the nearly oversold RSI hints at the Cable pair’s corrective bounce off the stated channel’s bottom line, close to 1.2570 at the latest.
It should be noted that April’s peak of around 1.2550 and 50% Fibonacci retracement of the pair’s March-July upside, near 1.2470, could challenge the GBP/USD bears afterward. In a case where the quote fails to bounce off 1.2470, it becomes vulnerable to test the 61.8% Fibonacci retracement level of around 1.2310.
On the contrary, GBP/USD bears keep the reins unless the quote defies the channel formation by crossing the 1.2790 hurdle. Even so, a convergence of the previous support line stretched from March and the 21-DMA, close to 1.2835-40 at the latest, appears a tough nut to crack for the Pound Sterling bulls.
Trend: Further downside expected
Technical Levels: Supports and Resistances
GBPUSD currently trading at 1.2674 at the time of writing. Pair opened at 1.2719 and is trading with a change of -0.35% % .
| Overview | Overview.1 | |
|---|---|---|
| 0 | Today last price | 1.2674 |
| 1 | Today Daily Change | -0.0045 |
| 2 | Today Daily Change % | -0.35% |
| 3 | Today daily open | 1.2719 |
The pair is trading below its 20 Daily moving average @ 1.2867, below its 50 Daily moving average @ 1.2757 , above its 100 Daily moving average @ 1.26 and above its 200 Daily moving average @ 1.2337
| Trends | Trends.1 | |
|---|---|---|
| 0 | Daily SMA20 | 1.2867 |
| 1 | Daily SMA50 | 1.2757 |
| 2 | Daily SMA100 | 1.2600 |
| 3 | Daily SMA200 | 1.2337 |
The previous day high was 1.2782 while the previous day low was 1.2712. The daily 38.2% Fib levels comes at 1.2739, expected to provide resistance. Similarly, the daily 61.8% fib level is at 1.2755, expected to provide resistance.
Note the levels of interest below:
- Pivot support is noted at 1.2693, 1.2668, 1.2623
- Pivot resistance is noted at 1.2763, 1.2808, 1.2834
| Levels | Levels.1 |
|---|---|
| Previous Daily High | 1.2782 |
| Previous Daily Low | 1.2712 |
| Previous Weekly High | 1.2873 |
| Previous Weekly Low | 1.2621 |
| Previous Monthly High | 1.3142 |
| Previous Monthly Low | 1.2659 |
| Daily Fibonacci 38.2% | 1.2739 |
| Daily Fibonacci 61.8% | 1.2755 |
| Daily Pivot Point S1 | 1.2693 |
| Daily Pivot Point S2 | 1.2668 |
| Daily Pivot Point S3 | 1.2623 |
| Daily Pivot Point R1 | 1.2763 |
| Daily Pivot Point R2 | 1.2808 |
| Daily Pivot Point R3 | 1.2834 |
[/s2If]
Download Nehcap EAWe have two EAs that are operational on our LIVE accounts.
- EA-FIX: Check out the details here. Download EA-FIX . EA-FIX is a non-grid HFT scalper.
- EA-GROWTH: High quality low dd EA using trend grids. Download EA_GROWTHJoin Our Telegram Group
")


