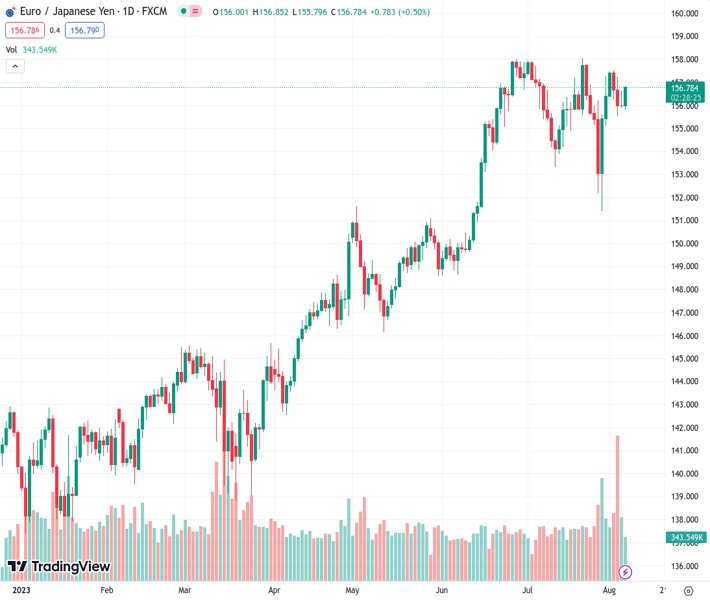
The EURJPY has increased for two days in a row and is currently higher than the 156.50 level.
…
This is a premium post.
[s2If !current_user_can(access_s2member_level4)]Please register for FREE REGISTER to read full post below containing analysis. In case of any error or you think you are not able to read the full post below, please email us at support#nehcap.com [lwa][/s2If] [s2If current_user_can(access_s2member_level1)]
- The EUR/JPY rises for a second consecutive day, standing above the 156.50 zone.
The pair currently trades last at 156.753.
The previous day high was 156.63 while the previous day low was 155.9. The daily 38.2% Fib levels comes at 156.18, expected to provide support. Similarly, the daily 61.8% fib level is at 156.35, expected to provide support.
At the start of the week, the Euro weakened against most of its rivals on the back of weak industrial data but held gains against the JPY. On the other hand, the Yen trades mixed following the release of the Bank of Japan (BoJ) summary of opinions from the July meeting.
Europe reported mixed data. August’s Sentix Investor Confidence from the Eurozone came in at -18.9, better than the -23.4 expected, while the German Industrial Production (IP) dropped by 1.5% in June, higher than the 0.4% decline expected. As a response, the German yields have weakened across the curve, clearing daily increases. The 10-year bond yield fell to 2.56% after hitting a high of 2.64%, while the 2-year yield sits at 3.12% and the 5-year yielding 2.59% after peaking at 2.65% earlier in the session.
Concerning the next European Central Bank meetings, tightening expectations remain low. According to World Interest Rate Possibilities (WIRP) tool, the markets are currently pricing in a 40% chance of a 25 bps hike in the September meeting, and 60% odds of a 25 bps hike in the October meeting, and a 70% probability of a hike in the December meeting.
On the Japanese side, the Bank of Japan’s (BoJ) summary of opinions revealed that several members favoured tweaking the Yield Control Curve (YCC), with members suggesting directly lifting the YCC to encourage bond investments. In that sense, these signals indicate that the BoJ may be on its way to dropping the YCC policy and eventually starting it’s tightening cycle, but the process won’t be quick. In the meantime, the JPY may see further downside on the back of monetary policy divergences against its rivals.
Analysing the daily chart, a neutral to bullish technical outlook is evident for EUR/JPY, suggesting that the bulls are gaining momentum but still do not have the upperhand in the short term. The Relative Strength Index (RSI) has a positive slope above its midline, while the Moving Average Convergence (MACD) displays decreasing red bars. Also, the pair is above the 20,100,200-day SMAs, implying that the bulls retain control on a broader scale.
Support levels: 155.80 (20-day SMA), 155.00, 154.00.
Resistance levels: 157.00, 157.50, 158.00.
Technical Levels: Supports and Resistances
EURJPY currently trading at 156.78 at the time of writing. Pair opened at 156.07 and is trading with a change of 0.45 % .
| Overview | Overview.1 | |
|---|---|---|
| 0 | Today last price | 156.78 |
| 1 | Today Daily Change | 0.71 |
| 2 | Today Daily Change % | 0.45 |
| 3 | Today daily open | 156.07 |
The pair remains strongly bullish on the daily timeframe. It trades above its 20 SMA @ 155.8, 50 SMA 154.51, 100 SMA @ 150.57 and 200 SMA @ 146.71.
| Trends | Trends.1 | |
|---|---|---|
| 0 | Daily SMA20 | 155.80 |
| 1 | Daily SMA50 | 154.51 |
| 2 | Daily SMA100 | 150.57 |
| 3 | Daily SMA200 | 146.71 |
The previous day high was 156.63 while the previous day low was 155.9. The daily 38.2% Fib levels comes at 156.18, expected to provide support. Similarly, the daily 61.8% fib level is at 156.35, expected to provide support.
Note the levels of interest below:
- Pivot support is noted at 155.77, 155.47, 155.03
- Pivot resistance is noted at 156.5, 156.93, 157.23
| Levels | Levels.1 |
|---|---|
| Previous Daily High | 156.63 |
| Previous Daily Low | 155.90 |
| Previous Weekly High | 157.50 |
| Previous Weekly Low | 155.11 |
| Previous Monthly High | 158.05 |
| Previous Monthly Low | 151.41 |
| Daily Fibonacci 38.2% | 156.18 |
| Daily Fibonacci 61.8% | 156.35 |
| Daily Pivot Point S1 | 155.77 |
| Daily Pivot Point S2 | 155.47 |
| Daily Pivot Point S3 | 155.03 |
| Daily Pivot Point R1 | 156.50 |
| Daily Pivot Point R2 | 156.93 |
| Daily Pivot Point R3 | 157.23 |
[/s2If]
Download Nehcap EAWe have two EAs that are operational on our LIVE accounts.
- EA-FIX: Check out the details here. Download EA-FIX . EA-FIX is a non-grid HFT scalper.
- EA-GROWTH: High quality low dd EA using trend grids. Download EA_GROWTHJoin Our Telegram Group


