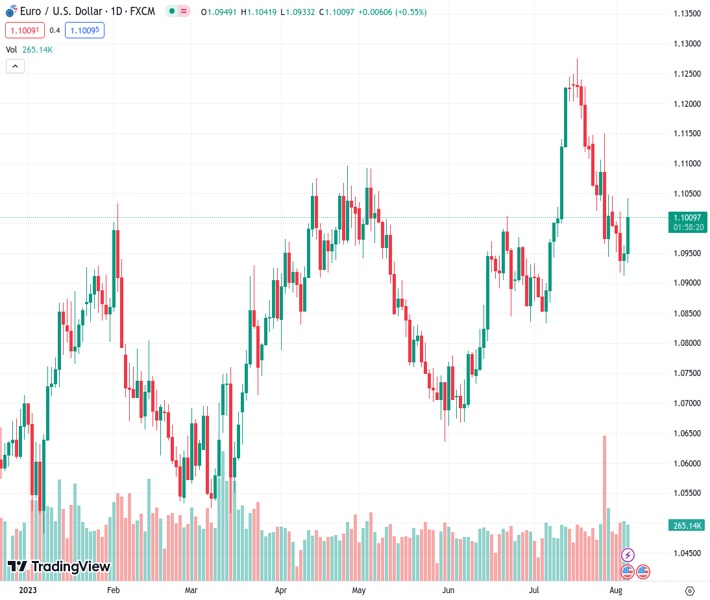
After the release of disappointing US economic data, the EURUSD exchange rate increased to a new peak for the week, surpassing 1.1004.
…
This is a premium post.
[s2If !current_user_can(access_s2member_level4)]Please register for FREE REGISTER to read full post below containing analysis. In case of any error or you think you are not able to read the full post below, please email us at support#nehcap.com [lwa][/s2If] [s2If current_user_can(access_s2member_level1)]
- Following weak US data, EUR/USD climbs to a new weekly high above 1.1004.
The pair currently trades last at 1.10091.
The previous day high was 1.0963 while the previous day low was 1.0912. The daily 38.2% Fib levels comes at 1.0944, expected to provide support. Similarly, the daily 61.8% fib level is at 1.0932, expected to provide support.
EUR/USD rallied sharply above the 1.1000 figure on Friday, reversing its earlier losses of 0.80%, and set to close the week in an upbeat tone and about to break above key technical indicators. Factors like US Dollar (USD) weakness, spurred by soft US economic data, bolstered the EUR/USD to new weekly highs of 1.1041. At the time of writing, the EUR/USD is trading at 1.1024, gains 0.69%.
The US Department of Labor revealed jobs data in the form of the Nonfarm Payrolls report for July, which showed the economy added just 187K people to the workforce, below estimates of 200K. Additionally, the Unemployment Rate hit 3.6%, above 3.5%. Although the data portrays the labor market as easing, it shows signs of resilience. It remains one of the main reasons that keep inflation at around 3%, making the US Federal Reserve (Fed) job more difficult. However, it’s too early to declare victory as wages edged up, with Average Hourly Earnings climbing to 4.4% YoY, exceeding estimates of 4.2%.
The EUR/USD strengthened on the report, as the market punished the greenback and US Treasury bond yields plunged. The US Dollar Index, a measure of the buck’s value against a basket of peers, dives 0.70% and trades at 101.766.
On the Eurozone (EU) front, Germany reported solid factory orders in June but was outweighed by soft Retail Sales amongst the whole bloc. June Retail Sales came at -0.3% MoM, below 0.2% estimates, and trailed May’s 0.6% upward revision. Following the data, interest rate probabilities for the European Central Bank (ECB) are subdued, with odds at a 35% chance of a 25 bps hike in September. But October and November estimations remain high at 60% and 70%, suggesting the ECB could follow the Fed’s path of skipping monetary policy meetings.
All in all, central banks, the Fed, and the ECB and in data-dependant mode, but the strength of the US economy, could send the EUR/USD’s drifting lower, despite Fitch’s recent US credit downgrade. Next week’s inflation releases in the US and Germany could give some clues regarding the actual status of prices. Soft readings could prevent both institutions from raising rates at their September meetings.
The EUR/USD is neutral to downward biased, despite reversing most of its losses and claiming the 20-day Exponential Moving Average (EMA) at 1.1021. To shift its bias to neutral, EUR/USD buyers must reclaim the April 26 low-turned resistance at 1.1095, followed by the 1.1100 mark. Break above will expose the July 27 daily high at 1.1149, followed by the 2021 daily low of 1.1186 and the 1.1200 mark. On the flip side, EUR/USD key support levels would be 1.1000, followed by the 50-day EMA at 1.0973. The break below will expose the August 3 low of 1.0912.
Technical Levels: Supports and Resistances
EURUSD currently trading at 1.1019 at the time of writing. Pair opened at 1.0949 and is trading with a change of 0.64 % .
| Overview | Overview.1 | |
|---|---|---|
| 0 | Today last price | 1.1019 |
| 1 | Today Daily Change | 0.0070 |
| 2 | Today Daily Change % | 0.6400 |
| 3 | Today daily open | 1.0949 |
The pair is trading below its 20 Daily moving average @ 1.1077, above its 50 Daily moving average @ 1.0931 , above its 100 Daily moving average @ 1.0917 and above its 200 Daily moving average @ 1.0739
| Trends | Trends.1 | |
|---|---|---|
| 0 | Daily SMA20 | 1.1077 |
| 1 | Daily SMA50 | 1.0931 |
| 2 | Daily SMA100 | 1.0917 |
| 3 | Daily SMA200 | 1.0739 |
The previous day high was 1.0963 while the previous day low was 1.0912. The daily 38.2% Fib levels comes at 1.0944, expected to provide support. Similarly, the daily 61.8% fib level is at 1.0932, expected to provide support.
Note the levels of interest below:
- Pivot support is noted at 1.092, 1.0891, 1.0869
- Pivot resistance is noted at 1.097, 1.0992, 1.1021
| Levels | Levels.1 |
|---|---|
| Previous Daily High | 1.0963 |
| Previous Daily Low | 1.0912 |
| Previous Weekly High | 1.1150 |
| Previous Weekly Low | 1.0944 |
| Previous Monthly High | 1.1276 |
| Previous Monthly Low | 1.0834 |
| Daily Fibonacci 38.2% | 1.0944 |
| Daily Fibonacci 61.8% | 1.0932 |
| Daily Pivot Point S1 | 1.0920 |
| Daily Pivot Point S2 | 1.0891 |
| Daily Pivot Point S3 | 1.0869 |
| Daily Pivot Point R1 | 1.0970 |
| Daily Pivot Point R2 | 1.0992 |
| Daily Pivot Point R3 | 1.1021 |
[/s2If]
Download Nehcap EAWe have two EAs that are operational on our LIVE accounts.
- EA-FIX: Check out the details here. Download EA-FIX . EA-FIX is a non-grid HFT scalper.
- EA-GROWTH: High quality low dd EA using trend grids. Download EA_GROWTHJoin Our Telegram Group


