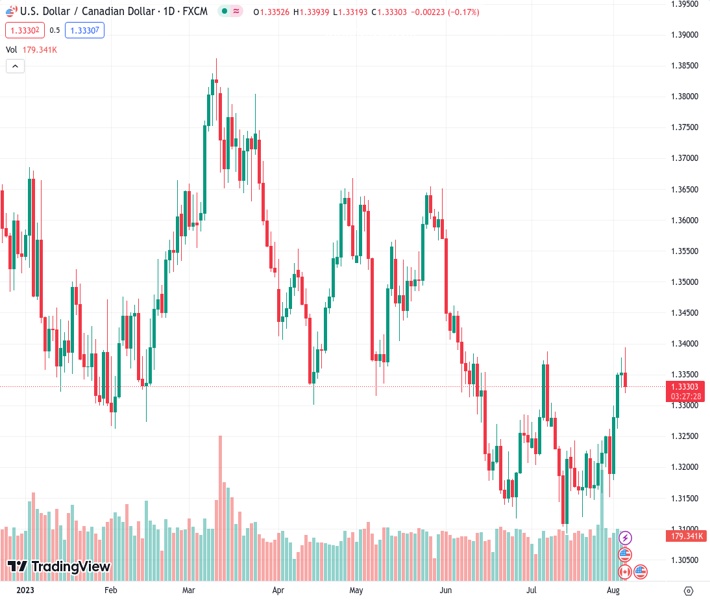
The USDCAD currency pair experienced a change in direction during the American trading session and was unable to break through the 100-day Simple Moving Average (SMA), resulting in a decline to approximately 1.3335.
…
This is a premium post.
[s2If !current_user_can(access_s2member_level4)]Please register for FREE REGISTER to read full post below containing analysis. In case of any error or you think you are not able to read the full post below, please email us at support#nehcap.com [lwa][/s2If] [s2If current_user_can(access_s2member_level1)]
- USD/CAD reversed its course during the American session and got rejected by the 100-day SMA, falling to near 1.3335.
The pair currently trades last at 1.33320.
The previous day high was 1.3378 while the previous day low was 1.3329. The daily 38.2% Fib levels comes at 1.3359, expected to provide resistance. Similarly, the daily 61.8% fib level is at 1.3348, expected to provide resistance.
On Friday, the USD/CAD cleared daily gains and fell into negative territory as investors dumped the USD following Nonfarm Payrolls revealing that job creation cooled down in July. Canada also reported weak labour market data, so what driving the pair downwards is mainly the broad USD weakness via lower US yields.
The latest Nonfarm Payrolls report for the US presented a mix of data, painting a complex picture of the labour market. In July, the headline indicated the creation of 187,000 jobs, which fell short of the anticipated 200,000 but still exceeded the revised figure of 185,000 from previous reports. On the positive side, the Average Hourly Earnings experienced a 0.4% increase in the same month, surpassing expectations. Additionally, the yearly figure for Average Hourly Earnings rose to 4.4%.
Overall, the American labour markets flashed mixed signals during the week, but it appears to remain unbalanced while the economic activity remains resilient. This means that the Federal Reserve (Fed) may consider hiking at least one more tambien in the remainder of the year. Investors have opted out of rising wages as US yields decreased. The 2-year yield decreased by more than 1% to 4.80%, while the 5-year rate lead the decline, falling by more than 2% to 4.19%. The 10-year rate also weakened and fell to 4.11%, a sharp decline.
On the Canadian side, labour market data came in soft. In July, the number of employed people contracted by 6,400 while markets expected 21,100 newly employed workers while the unemployment rate remained steady at 5.5% YoY. Other data showed that the Ivey PMI released by the Richard Ivey School of Business, which captures business conditions in Canada, came in at 48.6 vs the 52.7 expected.
The daily chart shows signs of bullish exhaustion for USD/CAD. The technical outlook appears neutral to bearish, with the Relative Strength Index (RSI) displaying a negative slope but staying above its midline and the Moving Average Convergence Divergence (MACD) showing fading green bars. Moreover, the pair is above the 20-day Simple Moving Average (SMA) but below the 100 and 200-day SMAs, indicating that the bulls aren’t done yet and that the outlook is stillin favour of the buyers.
Resistance levels: 1.3400 (100-day SMA), 1.3454 (200-day SMA), 1.3500.
Support levels: 1.3280, 1.3250, 1.3240.
Technical Levels: Supports and Resistances
USDCAD currently trading at 1.3328 at the time of writing. Pair opened at 1.3353 and is trading with a change of -0.19 % .
| Overview | Overview.1 | |
|---|---|---|
| 0 | Today last price | 1.3328 |
| 1 | Today Daily Change | -0.0025 |
| 2 | Today Daily Change % | -0.1900 |
| 3 | Today daily open | 1.3353 |
The pair is trading above its 20 Daily moving average @ 1.3221, above its 50 Daily moving average @ 1.3284 , below its 100 Daily moving average @ 1.3406 and below its 200 Daily moving average @ 1.3457
| Trends | Trends.1 | |
|---|---|---|
| 0 | Daily SMA20 | 1.3221 |
| 1 | Daily SMA50 | 1.3284 |
| 2 | Daily SMA100 | 1.3406 |
| 3 | Daily SMA200 | 1.3457 |
The previous day high was 1.3378 while the previous day low was 1.3329. The daily 38.2% Fib levels comes at 1.3359, expected to provide resistance. Similarly, the daily 61.8% fib level is at 1.3348, expected to provide resistance.
Note the levels of interest below:
- Pivot support is noted at 1.3329, 1.3304, 1.328
- Pivot resistance is noted at 1.3378, 1.3403, 1.3427
| Levels | Levels.1 |
|---|---|
| Previous Daily High | 1.3378 |
| Previous Daily Low | 1.3329 |
| Previous Weekly High | 1.3255 |
| Previous Weekly Low | 1.3147 |
| Previous Monthly High | 1.3387 |
| Previous Monthly Low | 1.3093 |
| Daily Fibonacci 38.2% | 1.3359 |
| Daily Fibonacci 61.8% | 1.3348 |
| Daily Pivot Point S1 | 1.3329 |
| Daily Pivot Point S2 | 1.3304 |
| Daily Pivot Point S3 | 1.3280 |
| Daily Pivot Point R1 | 1.3378 |
| Daily Pivot Point R2 | 1.3403 |
| Daily Pivot Point R3 | 1.3427 |
[/s2If]
Download Nehcap EAWe have two EAs that are operational on our LIVE accounts.
- EA-FIX: Check out the details here. Download EA-FIX . EA-FIX is a non-grid HFT scalper.
- EA-GROWTH: High quality low dd EA using trend grids. Download EA_GROWTHJoin Our Telegram Group


