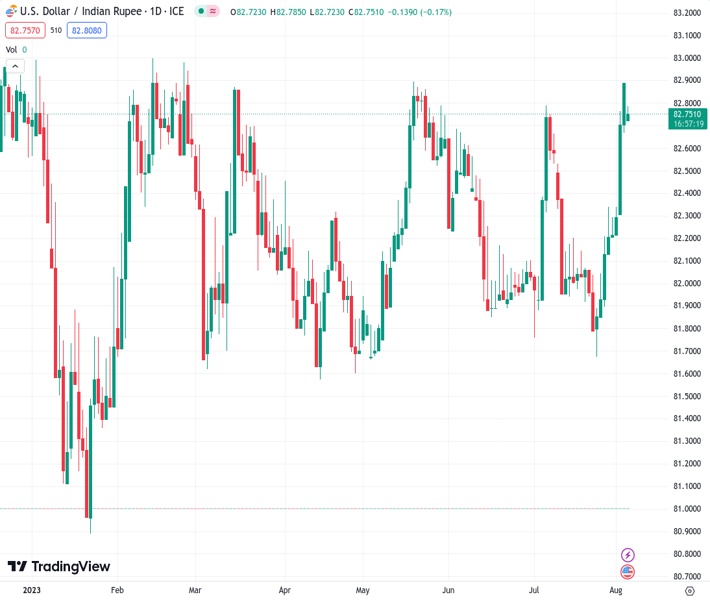
The USDINR currency pair remains stable around 82.78 after pulling back from its recent peak of 82.90, which was the highest level in several months.
…
This is a premium post.
[s2If !current_user_can(access_s2member_level4)]Please register for FREE REGISTER to read full post below containing analysis. In case of any error or you think you are not able to read the full post below, please email us at support#nehcap.com [lwa][/s2If] [s2If current_user_can(access_s2member_level1)]
- USD/INR holds ground near 82.78 after retreating from multi-month highs of 82.90.
The pair currently trades last at 82.7650.
The previous day high was 82.8948 while the previous day low was 82.6634. The daily 38.2% Fib levels comes at 82.8065, expected to provide resistance. Similarly, the daily 61.8% fib level is at 82.7518, expected to provide support.
The USD/INR pair loses traction during the Asian session on Friday. The pair currently trades within a large consolidation phase since October 2022 and holds above 82.70. Meanwhile, The US dollar Index (DXY), a measure of the value of USD against a basket of six influential currencies, takes a breather near 102.40 after approaching the weekly high of 102.85.
Market anticipated that the Indian Rupee (INR) is likely to move in a narrow range for the next three months as the Reserve Bank of India (RBI) utilises its enormous foreign exchange reserves to keep the currency steady, according to a Reuters poll. That said, the possibility that the RBI could periodically intervene to prevent the rupee from falling further might cap the upside for the USD/INR pair.
The mixed US economic data limits the downside for the Indian Rupee. The US Department of Labor showed on Thursday that Initial Jobless Claims increased to 227,000 for the week ended July 29, matching expectations. The ISM Service PMI for July dropped to 52.7 from 53.9 prior and was worse than expected at 53. Lastly, Unit Labor Costs from Q2 came in at 1.6%, lower than the 2.6% expected.
In the absence of the economic data release from India, market players prefer to wait on the sidelines ahead of the key event on Friday. The US Nonfarm Payrolls (NFP) are due later in the American session, and the data could provide a clear direction for the pair. The US economy is expected to have created 180,000 jobs in July.
From the technical perspective, two converging trend lines constitute the formation of a symmetrical triangle pattern on the daily chart. The Relative Strength Index (RSI) holds above 50, and the Moving Average Convergence/Divergence (MACD) stands in bullish territory, supporting the buyers for now.
Resistance levels: 83.00, 83.20, and 83.40.
Support levels: 82.40, 82.20, and 81.90.
Technical Levels: Supports and Resistances
USDINR currently trading at 82.8015 at the time of writing. Pair opened at 82.8306 and is trading with a change of -0.04 % .
| Overview | Overview.1 | |
|---|---|---|
| 0 | Today last price | 82.8015 |
| 1 | Today Daily Change | -0.0291 |
| 2 | Today Daily Change % | -0.0400 |
| 3 | Today daily open | 82.8306 |
The pair remains strongly bullish on the daily timeframe. It trades above its 20 SMA @ 82.2422, 50 SMA 82.2467, 100 SMA @ 82.1999 and 200 SMA @ 82.164.
| Trends | Trends.1 | |
|---|---|---|
| 0 | Daily SMA20 | 82.2422 |
| 1 | Daily SMA50 | 82.2467 |
| 2 | Daily SMA100 | 82.1999 |
| 3 | Daily SMA200 | 82.1640 |
The previous day high was 82.8948 while the previous day low was 82.6634. The daily 38.2% Fib levels comes at 82.8065, expected to provide resistance. Similarly, the daily 61.8% fib level is at 82.7518, expected to provide support.
Note the levels of interest below:
- Pivot support is noted at 82.6977, 82.5649, 82.4663
- Pivot resistance is noted at 82.9291, 83.0277, 83.1605
| Levels | Levels.1 |
|---|---|
| Previous Daily High | 82.8948 |
| Previous Daily Low | 82.6634 |
| Previous Weekly High | 82.3860 |
| Previous Weekly Low | 81.6588 |
| Previous Monthly High | 82.8334 |
| Previous Monthly Low | 81.6588 |
| Daily Fibonacci 38.2% | 82.8065 |
| Daily Fibonacci 61.8% | 82.7518 |
| Daily Pivot Point S1 | 82.6977 |
| Daily Pivot Point S2 | 82.5649 |
| Daily Pivot Point S3 | 82.4663 |
| Daily Pivot Point R1 | 82.9291 |
| Daily Pivot Point R2 | 83.0277 |
| Daily Pivot Point R3 | 83.1605 |
[/s2If]
Download Nehcap EAWe have two EAs that are operational on our LIVE accounts.
- EA-FIX: Check out the details here. Download EA-FIX . EA-FIX is a non-grid HFT scalper.
- EA-GROWTH: High quality low dd EA using trend grids. Download EA_GROWTHJoin Our Telegram Group


