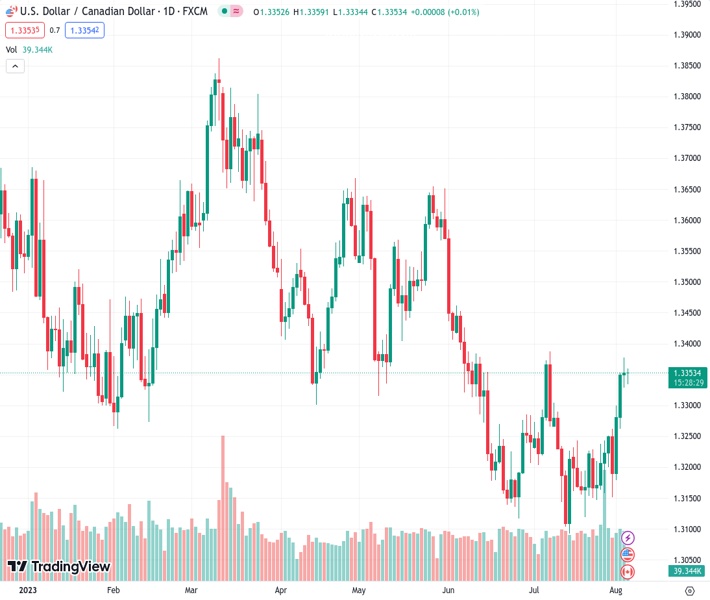
The USDCAD currency pair remains above the level of 1.3350 as it awaits important employment data from both the United States and Canada.
…
This is a premium post.
[s2If !current_user_can(access_s2member_level4)]Please register for FREE REGISTER to read full post below containing analysis. In case of any error or you think you are not able to read the full post below, please email us at support#nehcap.com [lwa][/s2If] [s2If current_user_can(access_s2member_level1)]
- USD/CAD holds above the 1.3350 mark ahead of top-tier employment data from the US and Canada.
The pair currently trades last at 1.33546.
The previous day high was 1.3378 while the previous day low was 1.3329. The daily 38.2% Fib levels comes at 1.3359, expected to provide resistance. Similarly, the daily 61.8% fib level is at 1.3348, expected to provide support.
The USD/CAD pair consolidates its recent gains heading into the early European session on Friday. The major currently trades near 1.3355, gaining 0.02% for the day. Market players await employment data from the US and Canada for fresh impetus.
Data released from the US on Thursday showed mixed readings. That said, the US Initial Jobless Claims increased to 227,000 for the week ended July 29, matching expectations. At the same time, the ISM Service PMI for July dropped to 52.7 from 53.9 prior and was worse than expected at 53. Additionally, Unit Labor Costs from Q2 increased to 1.6%, lower than the 2.6% expected. Investors will take more cues from US wage inflation and US employment data later in the day. The upbeat data could convince the Federal Reserve (Fed) to hike additional rates this year, which benefits the US Dollar and acts as a tailwind for the USD/CAD pair.
On the Canadian Dollar front, investors await the Canadian Employment Change on Friday as it could offer hints into the strength of domestic activity and the direction of the BoC’s monetary policy. Earlier this week, the S&P Global Canada Manufacturing PMI rose to 49.6 versus 48.8 prior and was better than expected at 48.9. Meanwhile, the rebound in oil prices has underpinned the Loonie since Canada is the largest oil exporter to the United States.
Moving on, market participants will keep an eye on the Canadian Employment Change and Nonfarm Payrolls. The US economy is expected to have created 180,000 jobs in July. While economists forecast that the Canadian economy will create 21,100 jobs. The data will be critical for determining a clear movement for the USD/CAD pair.
According to the one-hour chart, the further upside appears favorable for USD/CAD as the Relative Strength Index (RSI) stands in the bullish territory above 50. The immediate resistance level is seen at 1.3378 (High of August 3), and the initial support level appears at 1.3328 (Low of August 3), followed by 1.3300 (a psychological round mark).
Technical Levels: Supports and Resistances
USDCAD currently trading at 1.3357 at the time of writing. Pair opened at 1.3353 and is trading with a change of 0.03 % .
| Overview | Overview.1 | |
|---|---|---|
| 0 | Today last price | 1.3357 |
| 1 | Today Daily Change | 0.0004 |
| 2 | Today Daily Change % | 0.0300 |
| 3 | Today daily open | 1.3353 |
The pair is trading above its 20 Daily moving average @ 1.3221, above its 50 Daily moving average @ 1.3284 , below its 100 Daily moving average @ 1.3406 and below its 200 Daily moving average @ 1.3457
| Trends | Trends.1 | |
|---|---|---|
| 0 | Daily SMA20 | 1.3221 |
| 1 | Daily SMA50 | 1.3284 |
| 2 | Daily SMA100 | 1.3406 |
| 3 | Daily SMA200 | 1.3457 |
The previous day high was 1.3378 while the previous day low was 1.3329. The daily 38.2% Fib levels comes at 1.3359, expected to provide resistance. Similarly, the daily 61.8% fib level is at 1.3348, expected to provide support.
Note the levels of interest below:
- Pivot support is noted at 1.3329, 1.3304, 1.328
- Pivot resistance is noted at 1.3378, 1.3403, 1.3427
| Levels | Levels.1 |
|---|---|
| Previous Daily High | 1.3378 |
| Previous Daily Low | 1.3329 |
| Previous Weekly High | 1.3255 |
| Previous Weekly Low | 1.3147 |
| Previous Monthly High | 1.3387 |
| Previous Monthly Low | 1.3093 |
| Daily Fibonacci 38.2% | 1.3359 |
| Daily Fibonacci 61.8% | 1.3348 |
| Daily Pivot Point S1 | 1.3329 |
| Daily Pivot Point S2 | 1.3304 |
| Daily Pivot Point S3 | 1.3280 |
| Daily Pivot Point R1 | 1.3378 |
| Daily Pivot Point R2 | 1.3403 |
| Daily Pivot Point R3 | 1.3427 |
[/s2If]
Download Nehcap EAWe have two EAs that are operational on our LIVE accounts.
- EA-FIX: Check out the details here. Download EA-FIX . EA-FIX is a non-grid HFT scalper.
- EA-GROWTH: High quality low dd EA using trend grids. Download EA_GROWTHJoin Our Telegram Group


