The USDCHF pair begins the week with a positive start, surpassing the 0.8900 mark on Monday.
…
This is a premium post.
[s2If !current_user_can(access_s2member_level4)]Please register for FREE REGISTER to read full post below containing analysis. In case of any error or you think you are not able to read the full post below, please email us at support#nehcap.com [lwa][/s2If] [s2If current_user_can(access_s2member_level1)]
- The USD/CHF starts a new week on a positive note and edges above 0.8900 on Monday.
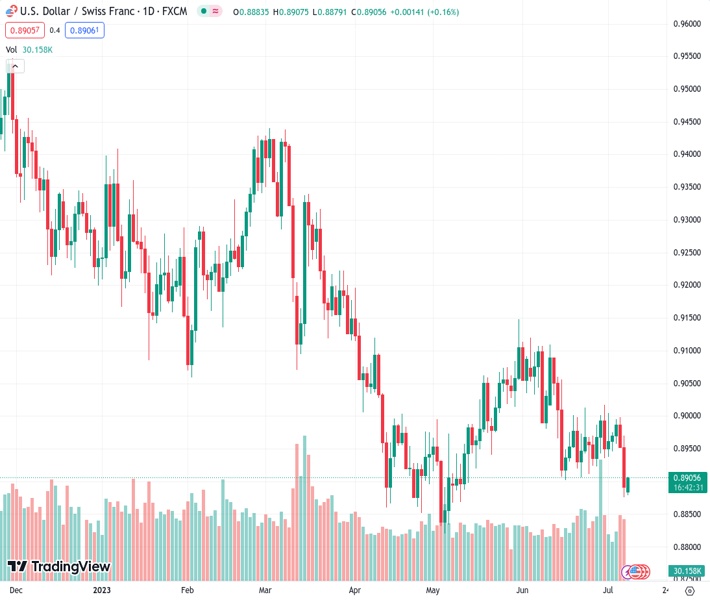
The pair currently trades last at 0.89060.
The previous day high was 0.897 while the previous day low was 0.8876. The daily 38.2% Fib levels comes at 0.8912, expected to provide resistance. Similarly, the daily 61.8% fib level is at 0.8934, expected to provide resistance.
USD/CHF edges higher to 0.8900 area during the Asian trading hours on Monday. The pair rebounds from a two-month low of 0.8875 as the US Dollar (USD) resumes the demand. The pair currently trades near 0.8905, up to 0.20% on the day.
According to the one-hour chart, USD/CHF holds below the 25-hour and the 50-hour Exponential Moving Averages (EMA), which means the path of least resistance for the USD/CHF pair is to the downside.
The initial resistance level is seen at 0.8914, representing the 25-hour EMA en route to 0.8932, the 50-hour EMA. A break above the latter would see an increase to 0.8950, representing the horizontal line.
On the flip side, the 0.8880 area acts as an immediate support level (low of July 7). A breach of the mentioned level would expose to 0.8870 (low of May 10), followed by 0.8835 (low of May 5).
Meanwhile, the Relative Strength Index (RSI) stands below 50, bearish territory, meaning the extended downside cannot be ruled out.
Technical Levels: Supports and Resistances
USDCHF currently trading at 0.8906 at the time of writing. Pair opened at 0.8889 and is trading with a change of 0.19 % .
| Overview | Overview.1 | |
|---|---|---|
| 0 | Today last price | 0.8906 |
| 1 | Today Daily Change | 0.0017 |
| 2 | Today Daily Change % | 0.1900 |
| 3 | Today daily open | 0.8889 |
The pair remains strongly bearish on the daily time frame. It trades below the 20 SMA @ 0.8969, 50 SMA 0.8984, 100 SMA @ 0.9071 and 200 SMA @ 0.9282.
| Trends | Trends.1 | |
|---|---|---|
| 0 | Daily SMA20 | 0.8969 |
| 1 | Daily SMA50 | 0.8984 |
| 2 | Daily SMA100 | 0.9071 |
| 3 | Daily SMA200 | 0.9282 |
The previous day high was 0.897 while the previous day low was 0.8876. The daily 38.2% Fib levels comes at 0.8912, expected to provide resistance. Similarly, the daily 61.8% fib level is at 0.8934, expected to provide resistance.
Note the levels of interest below:
- Pivot support is noted at 0.8853, 0.8817, 0.8759
- Pivot resistance is noted at 0.8948, 0.9006, 0.9042
| Levels | Levels.1 |
|---|---|
| Previous Daily High | 0.8970 |
| Previous Daily Low | 0.8876 |
| Previous Weekly High | 0.9005 |
| Previous Weekly Low | 0.8876 |
| Previous Monthly High | 0.9120 |
| Previous Monthly Low | 0.8902 |
| Daily Fibonacci 38.2% | 0.8912 |
| Daily Fibonacci 61.8% | 0.8934 |
| Daily Pivot Point S1 | 0.8853 |
| Daily Pivot Point S2 | 0.8817 |
| Daily Pivot Point S3 | 0.8759 |
| Daily Pivot Point R1 | 0.8948 |
| Daily Pivot Point R2 | 0.9006 |
| Daily Pivot Point R3 | 0.9042 |
[/s2If]
Download Nehcap EAWe have two EAs that are operational on our LIVE accounts.
- EA-FIX: Check out the details here. Download EA-FIX . EA-FIX is a non-grid HFT scalper.
- EA-GROWTH: High quality low dd EA using trend grids. Download EA_GROWTHJoin Our Telegram Group
")


