The USDCAD currency pair experiences a slight increase in value on Monday, supported by a variety of factors.
…
This is a premium post.
[s2If !current_user_can(access_s2member_level4)]Please register for FREE REGISTER to read full post below containing analysis. In case of any error or you think you are not able to read the full post below, please email us at support#nehcap.com [lwa][/s2If] [s2If current_user_can(access_s2member_level1)]
- USD/CAD gains some positive traction on Monday and draws support from a combination of factors.
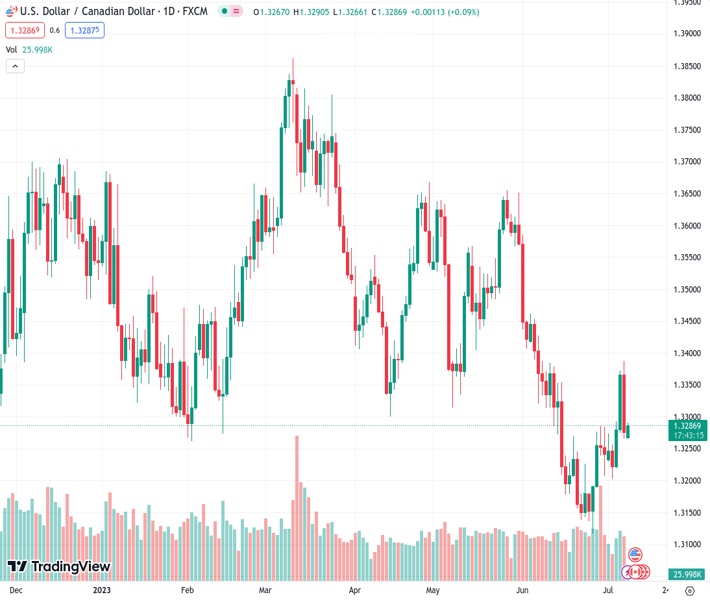
The pair currently trades last at 1.32858.
The previous day high was 1.3387 while the previous day low was 1.3266. The daily 38.2% Fib levels comes at 1.3312, expected to provide resistance. Similarly, the daily 61.8% fib level is at 1.3341, expected to provide resistance.
The USD/CAD pair attracts some buying on the first day of a new week and for now, seems to have stalled its rejection slide from the 50-day Simple Moving Average (SMA), around the 1.3385 area, or a nearly one-month high touched on Friday. Spot prices, however, struggle to capitalize on the modest intraday uptick and remain below the 1.3300 mark through the Asian session.
Crude Oil prices pull back from a five-week high, which, in turn, undermines the commodity-linked Loonie and turns out to be a key factor acting as a tailwind for the USD/CAD pair. The US Dollar (USD), on the other hand, regains some positive traction and reverses a part of Friday’s post-NFP downfall to its lowest level since June 22. This lends additional support to the major, though reduced bets for additional rate hikes by the Federal Reserve (Fed), after the one expected in July, keep a lid on any meaningful appreciating move.
The strong US wage growth data and a slight drop in the unemployment rate should allow the Fed to raise interest rates at its upcoming policy meeting on July 25-26. This remains supportive of elevated US Treasury bond yields and helps revive the USD demand. That said, signs that the US labor market conditions were finally easing and that the inflation is gradually slowing, fueled speculations that the Fed will eventually soften its hawkish. This might hold back the USD bulls from placing aggressive bets and cap the USD/CAD pair.
Furthermore, the recent announcement by the world’s biggest oil exporters – Saudi Arabia and Russia – to deepen supply cuts in August should limit the downside for Oil prices. Traders also seem reluctant and prefer to wait on the sidelines ahead of this week’s release of the latest US consumer inflation figures on Wednesday. This further makes it prudent to wait for strong follow-through buying around the USD/CAD pair before positioning for the resumption of the recent recovery from the 1.3115 area, or the YTD low touched in June.
Technical Levels: Supports and Resistances
USDCAD currently trading at 1.3284 at the time of writing. Pair opened at 1.3273 and is trading with a change of 0.08 % .
| Overview | Overview.1 | |
|---|---|---|
| 0 | Today last price | 1.3284 |
| 1 | Today Daily Change | 0.0011 |
| 2 | Today Daily Change % | 0.0800 |
| 3 | Today daily open | 1.3273 |
The pair is trading above its 20 Daily moving average @ 1.3244, below its 50 Daily moving average @ 1.3392 , below its 100 Daily moving average @ 1.3489 and below its 200 Daily moving average @ 1.3503
| Trends | Trends.1 | |
|---|---|---|
| 0 | Daily SMA20 | 1.3244 |
| 1 | Daily SMA50 | 1.3392 |
| 2 | Daily SMA100 | 1.3489 |
| 3 | Daily SMA200 | 1.3503 |
The previous day high was 1.3387 while the previous day low was 1.3266. The daily 38.2% Fib levels comes at 1.3312, expected to provide resistance. Similarly, the daily 61.8% fib level is at 1.3341, expected to provide resistance.
Note the levels of interest below:
- Pivot support is noted at 1.323, 1.3188, 1.3109
- Pivot resistance is noted at 1.3351, 1.343, 1.3472
| Levels | Levels.1 |
|---|---|
| Previous Daily High | 1.3387 |
| Previous Daily Low | 1.3266 |
| Previous Weekly High | 1.3387 |
| Previous Weekly Low | 1.3203 |
| Previous Monthly High | 1.3585 |
| Previous Monthly Low | 1.3117 |
| Daily Fibonacci 38.2% | 1.3312 |
| Daily Fibonacci 61.8% | 1.3341 |
| Daily Pivot Point S1 | 1.3230 |
| Daily Pivot Point S2 | 1.3188 |
| Daily Pivot Point S3 | 1.3109 |
| Daily Pivot Point R1 | 1.3351 |
| Daily Pivot Point R2 | 1.3430 |
| Daily Pivot Point R3 | 1.3472 |
[/s2If]
Download Nehcap EAWe have two EAs that are operational on our LIVE accounts.
- EA-FIX: Check out the details here. Download EA-FIX . EA-FIX is a non-grid HFT scalper.
- EA-GROWTH: High quality low dd EA using trend grids. Download EA_GROWTHJoin Our Telegram Group
")


