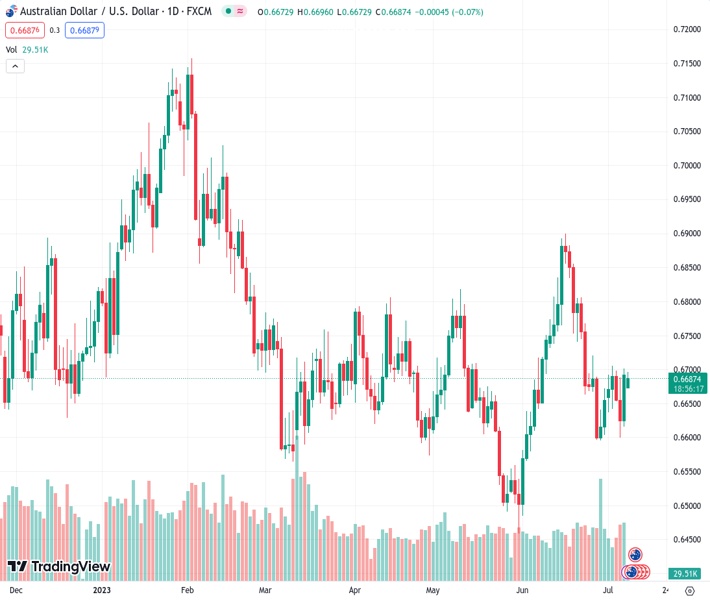
During the Asian session on Monday, the AUDUSD currency pair, trading at 0.66884, remains below the 200-day SMA.
…
This is a premium post.
[s2If !current_user_can(access_s2member_level4)]Please register for FREE REGISTER to read full post below containing analysis. In case of any error or you think you are not able to read the full post below, please email us at support#nehcap.com [lwa][/s2If] [s2If current_user_can(access_s2member_level1)]
- AUD/USD remains below the 200-day SMA through the Asian session on Monday.
The pair currently trades last at 0.66884.
The previous day high was 0.6701 while the previous day low was 0.662. The daily 38.2% Fib levels comes at 0.667, expected to provide support. Similarly, the daily 61.8% fib level is at 0.6651, expected to provide support.
The AUD/USD pair struggles to capitalize on Friday’s strong positive move and remains below the 0.6700 mark, or a technically significant 200-day Simple Moving Average (SMA) through the Asian session on Monday.
The prospects for further policy tightening by the Federal Reserve (Fed) later this month remain supportive of elevated US Treasury bond yields and assist the US Dollar (USD) to attract some buyers on the first day of a new week. In fact, the USD Index (DXY), which tracks the Greenback against a basket of currencies, recovers a part of Friday’s heavy losses to a fresh monthly low and turns out to be a key factor acting as a headwind for the AUD/USD pair.
That said, reduced bets for any further interest rate hike by the Fed after the one expected in July might hold back traders from positioning for any meaningful upside for the USD. Investors seem convinced that the US central bank will soften its hawkish stance sooner rather than later and the expectations were fueled by the rather unimpressive US jobs report on Friday, which showed that the economy added the fewest jobs in 2-1/2 years in June.
The aforementioned fundamental backdrop suggests that the path of least resistance for the AUD/USD pair is to the upside, though China’s economic woes continue to act as a headwind for the China-proxy Aussie. The worries were fueled by softer Chinese inflation figures, which showed that the headline CPI fell 0.2% in June and the yearly rate remained flat. Moreover, the Producer Price Index (PPI) fell by the 5.4% YoY rate during the reported month.
In the absence of any relevant market-moving economic releases from the US, traders on Monday will take cues from a speech by Fed Governor Michael Barr. This, along with the US bond yields, might influence the USD and provide some impetus to the AUD/USD pair. The focus, however, remains glued to this week’s release of the latest US consumer inflation figures, due on Wednesday, which will play a key role in driving the USD demand in the near term.
Technical Levels: Supports and Resistances
AUDUSD currently trading at 0.6695 at the time of writing. Pair opened at 0.6691 and is trading with a change of 0.06 % .
| Overview | Overview.1 | |
|---|---|---|
| 0 | Today last price | 0.6695 |
| 1 | Today Daily Change | 0.0004 |
| 2 | Today Daily Change % | 0.0600 |
| 3 | Today daily open | 0.6691 |
The pair is trading below its 20 Daily moving average @ 0.6726, above its 50 Daily moving average @ 0.6677 , above its 100 Daily moving average @ 0.6687 and below its 200 Daily moving average @ 0.6697
| Trends | Trends.1 | |
|---|---|---|
| 0 | Daily SMA20 | 0.6726 |
| 1 | Daily SMA50 | 0.6677 |
| 2 | Daily SMA100 | 0.6687 |
| 3 | Daily SMA200 | 0.6697 |
The previous day high was 0.6701 while the previous day low was 0.662. The daily 38.2% Fib levels comes at 0.667, expected to provide support. Similarly, the daily 61.8% fib level is at 0.6651, expected to provide support.
Note the levels of interest below:
- Pivot support is noted at 0.664, 0.6589, 0.6559
- Pivot resistance is noted at 0.6722, 0.6752, 0.6803
| Levels | Levels.1 |
|---|---|
| Previous Daily High | 0.6701 |
| Previous Daily Low | 0.6620 |
| Previous Weekly High | 0.6705 |
| Previous Weekly Low | 0.6599 |
| Previous Monthly High | 0.6900 |
| Previous Monthly Low | 0.6484 |
| Daily Fibonacci 38.2% | 0.6670 |
| Daily Fibonacci 61.8% | 0.6651 |
| Daily Pivot Point S1 | 0.6640 |
| Daily Pivot Point S2 | 0.6589 |
| Daily Pivot Point S3 | 0.6559 |
| Daily Pivot Point R1 | 0.6722 |
| Daily Pivot Point R2 | 0.6752 |
| Daily Pivot Point R3 | 0.6803 |
[/s2If]
Download Nehcap EAWe have two EAs that are operational on our LIVE accounts.
- EA-FIX: Check out the details here. Download EA-FIX . EA-FIX is a non-grid HFT scalper.
- EA-GROWTH: High quality low dd EA using trend grids. Download EA_GROWTHJoin Our Telegram Group
")


