The USDJPY pair, trading at 144.267, experiences a retreat from its year-to-date high after Japan’s Finance Minister Suzuky cautions against the yen depreciating too much.
…
This is a premium post.
[s2If !current_user_can(access_s2member_level4)]Please register for FREE REGISTER to read full post below containing analysis. In case of any error or you think you are not able to read the full post below, please email us at support#nehcap.com [lwa][/s2If] [s2If current_user_can(access_s2member_level1)]
- The USD/JPY pulls back from YTD high as Japan’s Finance Minister Suzuky warns against excessive yen depreciation.
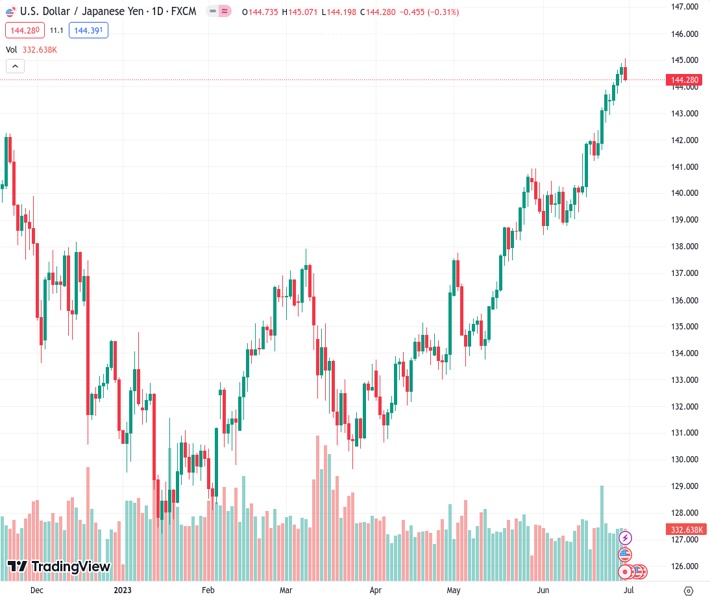
The pair currently trades last at 144.267.
The previous day high was 144.9 while the previous day low was 144.14. The daily 38.2% Fib levels comes at 144.61, expected to provide resistance. Similarly, the daily 61.8% fib level is at 144.43, expected to provide resistance.
USD/JPY retreats from a year-to-date (YTD) high at 145.07 as Japanese authorities warned that “excessive yen weakening” could trigger action by Japanese authorities. That spooked USD/JPY buyers, which have been riding a rally that witnessed a 13% depreciation of the Japanese Yen (JPY) during the year. The USD/JPY is trading at 144.28, down 0.31%, as Wall Street closes.
The US Dollar (USD) remains pressured by an inflation report released by the Department of Commerce. The US Federal Reserve (Fed) preferred gauge for inflation, the Core PCE eased from highs around 4.7% YoY to 4.6% in May, while headline PCE decelerated at a faster pace, with monthly data slowing to 0.1% from 0.4% in April, and annually based numbers at 3.8% from 4.4%.
US Treasury bond yields tumbled after the data as investors see less likely the Fed will increase rates twice, as the dot-plot portrays. Meanwhile, the Fed’s 25 bps increase in July remains priced in, as shown by the CME FedWatch Tool odds at 84.3%.
Consequently, the US Dollar Index, a basket of peers that tracks its value against the greenback, dropped 0.41%, down to 102.933.
Other data witnessed the Chicago PMI improving to 41.5 but remaining in contractionary territory. The University of Michigan (UoM) revealed June’s latest poll, with Consumer Sentiment hitting the 64.4 threshold, above the preliminary reading of 63.9.
On the Japanese front, the Tokyo Core CPI, a critical inflation gauge, edged higher in June, with the index coming at 3.2% YoY, up from 3.1% in May. Even though the CPI stood higher than the Bank of Japan’s (BoJ) 2% target for the thirteen-month, the BoJ remains committed to keeping its ultra-loose monetary policy stance. The BoJ Governor Kazuo Ueda stated the bank would keep its current path unless inflation proves to be sustainable over the long term.
Given the backdrop, the USD/JPY was set to continue to rally. Still, Japanese Finance Minister Suzuky’s comments that Tokyo “would respond appropriately if the moves become excessive” capped the USD/JPY advancement.
Technical Levels: Supports and Resistances
USDJPY currently trading at 144.35 at the time of writing. Pair opened at 144.75 and is trading with a change of -0.28 % .
| Overview | Overview.1 | |
|---|---|---|
| 0 | Today last price | 144.35 |
| 1 | Today Daily Change | -0.40 |
| 2 | Today Daily Change % | -0.28 |
| 3 | Today daily open | 144.75 |
The pair remains strongly bullish on the daily timeframe. It trades above its 20 SMA @ 141.43, 50 SMA 138.6, 100 SMA @ 136.14 and 200 SMA @ 137.23.
| Trends | Trends.1 | |
|---|---|---|
| 0 | Daily SMA20 | 141.43 |
| 1 | Daily SMA50 | 138.60 |
| 2 | Daily SMA100 | 136.14 |
| 3 | Daily SMA200 | 137.23 |
The previous day high was 144.9 while the previous day low was 144.14. The daily 38.2% Fib levels comes at 144.61, expected to provide resistance. Similarly, the daily 61.8% fib level is at 144.43, expected to provide resistance.
Note the levels of interest below:
- Pivot support is noted at 144.29, 143.83, 143.52
- Pivot resistance is noted at 145.06, 145.36, 145.82
| Levels | Levels.1 |
|---|---|
| Previous Daily High | 144.90 |
| Previous Daily Low | 144.14 |
| Previous Weekly High | 143.87 |
| Previous Weekly Low | 141.21 |
| Previous Monthly High | 140.93 |
| Previous Monthly Low | 133.50 |
| Daily Fibonacci 38.2% | 144.61 |
| Daily Fibonacci 61.8% | 144.43 |
| Daily Pivot Point S1 | 144.29 |
| Daily Pivot Point S2 | 143.83 |
| Daily Pivot Point S3 | 143.52 |
| Daily Pivot Point R1 | 145.06 |
| Daily Pivot Point R2 | 145.36 |
| Daily Pivot Point R3 | 145.82 |
[/s2If]
Nehcap Expert Advisor
The NEHCAP MT4 EA is high quality professional trading system geared to generate returns without using GRID or martingales. Each trade has strict risk per trade parameter. The pairs under management include EURUSD, GBPUSD, AUDCAD, AUDNZD,GBPAUD, EURAUD, EURCAD, CHFJPY and many more.
The system is trading live: LIVE ACCOUNT TRACKING
You can run it free. Apply for a free trial and track our account. Buy the system or use profit share mechanism to generate returns on your MT4.
Join Our Telegram Group
")


