The US dollar lost strength after the release of consumer inflation data, causing XAUUSD to reach 1,915.82.
…
This is a premium post.
[s2If !current_user_can(access_s2member_level4)]Please register for FREE REGISTER to read full post below containing analysis. In case of any error or you think you are not able to read the full post below, please email us at support#nehcap.com [lwa][/s2If] [s2If current_user_can(access_s2member_level1)]
- The US dollar weakened following consumer inflation data.
The pair currently trades last at 1915.82.
The previous day high was 1913.17 while the previous day low was 1893.01. The daily 38.2% Fib levels comes at 1905.47, expected to provide support. Similarly, the daily 61.8% fib level is at 1900.71, expected to provide support.
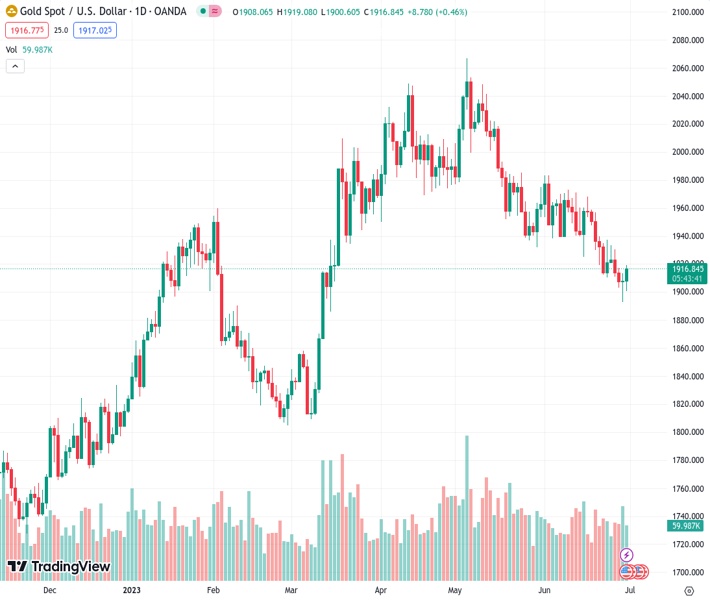
Gold prices are having their best day in weeks on Friday, boosted by a decline in the US dollar across the board. XAU/USD jumped from near $1,905 to $1,920 following the release of the US Core Personal Consumption Expenditure Price Index.
The consumption inflation figures showed a decline slightly higher than expected and triggered a retreat in US yields and boosted equity and commodity prices. The US Core PCE fell in May to 4.6% on an annual basis from 4.7%, while the headline dropped from 4.6% to 3.8%.
These figures softened Federal Reserve rate hike expectations for the next meeting. The focus now turns to next week’s US labor market data, which includes the ADP, Jobless Claims (Thursday), and the Nonfarm Payrolls report (Friday).
XAU/USD is hovering around $1,915, up less than $10 but enough to make it the best day in weeks. The recovery took place after reaching a low on Thursday at $1,892, the lowest level in three months.
On the upside, XAU/USD is breaking a short-term downtrend line. The next resistance area is $1,920. On the downside, a decline below $1,905 would weaken the short-term outlook for the yellow metal.
Technical Levels: Supports and Resistances
XAUUSD currently trading at 1916.49 at the time of writing. Pair opened at 1908.2 and is trading with a change of 0.43 % .
| Overview | Overview.1 | |
|---|---|---|
| 0 | Today last price | 1916.49 |
| 1 | Today Daily Change | 8.29 |
| 2 | Today Daily Change % | 0.43 |
| 3 | Today daily open | 1908.20 |
The pair is trading below its 20 Daily moving average @ 1940.32, below its 50 Daily moving average @ 1970.36 , below its 100 Daily moving average @ 1943.91 and above its 200 Daily moving average @ 1858.19
| Trends | Trends.1 | |
|---|---|---|
| 0 | Daily SMA20 | 1940.32 |
| 1 | Daily SMA50 | 1970.36 |
| 2 | Daily SMA100 | 1943.91 |
| 3 | Daily SMA200 | 1858.19 |
The previous day high was 1913.17 while the previous day low was 1893.01. The daily 38.2% Fib levels comes at 1905.47, expected to provide support. Similarly, the daily 61.8% fib level is at 1900.71, expected to provide support.
Note the levels of interest below:
- Pivot support is noted at 1896.42, 1884.63, 1876.26
- Pivot resistance is noted at 1916.58, 1924.95, 1936.74
| Levels | Levels.1 |
|---|---|
| Previous Daily High | 1913.17 |
| Previous Daily Low | 1893.01 |
| Previous Weekly High | 1958.85 |
| Previous Weekly Low | 1910.18 |
| Previous Monthly High | 2079.76 |
| Previous Monthly Low | 1932.12 |
| Daily Fibonacci 38.2% | 1905.47 |
| Daily Fibonacci 61.8% | 1900.71 |
| Daily Pivot Point S1 | 1896.42 |
| Daily Pivot Point S2 | 1884.63 |
| Daily Pivot Point S3 | 1876.26 |
| Daily Pivot Point R1 | 1916.58 |
| Daily Pivot Point R2 | 1924.95 |
| Daily Pivot Point R3 | 1936.74 |
[/s2If]
Nehcap Expert Advisor
The NEHCAP MT4 EA is high quality professional trading system geared to generate returns without using GRID or martingales. Each trade has strict risk per trade parameter. The pairs under management include EURUSD, GBPUSD, AUDCAD, AUDNZD,GBPAUD, EURAUD, EURCAD, CHFJPY and many more.
The system is trading live: LIVE ACCOUNT TRACKING
You can run it free. Apply for a free trial and track our account. Buy the system or use profit share mechanism to generate returns on your MT4.
Join Our Telegram Group
")


