Gold price at 1,915.78 (XAUUSD) draws in a few buyers in the Asian session, but fails to sustain momentum.
…
This is a premium post.
[s2If !current_user_can(access_s2member_level4)]Please register for FREE REGISTER to read full post below containing analysis. In case of any error or you think you are not able to read the full post below, please email us at support#nehcap.com [lwa][/s2If] [s2If current_user_can(access_s2member_level1)]
- Gold price attracts some buyers during the Asian session, albeit lacks follow-through.
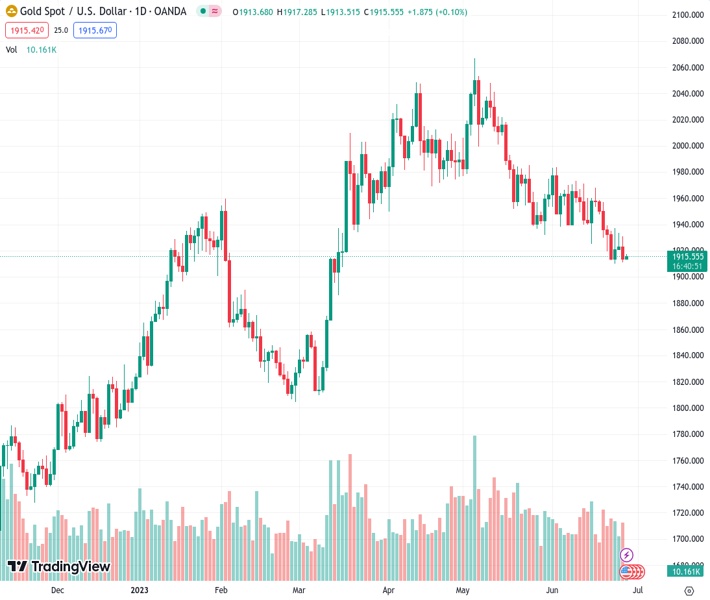
The pair currently trades last at 1915.78.
The previous day high was 1930.75 while the previous day low was 1910.93. The daily 38.2% Fib levels comes at 1918.5, expected to provide resistance. Similarly, the daily 61.8% fib level is at 1923.18, expected to provide resistance.
Gold price edges higher during the Asian session on Wednesday and recovers a part of the previous day’s losses, though the intraday uptick lacks bullish conviction. The XAU/USD currently trades around the $1,915 region and remains well within the striking distance of its lowest level since March 16 touched last Friday.
The Wall Street Journal reported on Tuesday that the United States (US) is considering new restrictions on exports of artificial intelligence chips to China. This points to a further deterioration in relations between the world’s two largest economies, which, to a larger extent, overshadows the latest optimism over China’s economic prospects and lends some support to the safe-haven Gold price. In fact, China’s Premier Li Qiang, during the keynote speech on Tuesday at the World Economic Forum in Tianjin, said that economic growth in the second quarter will be higher than the first and is expected to reach the annual projected target of around 5%.
The upside for Gold price, however, remains capped in the wake of the Federal Reserve’s (Fed) hawkish outlook, signalling that borrowing costs may still need to rise as much as 50 bps by the end of this year. Furthermore, Fed Chair Jerome Powell said last week that the US central bank doesn’t see rate cuts happening any time soon and will wait until it is confident that inflation is moving down to the 2% target. This, along with the upbeat US macro data released on Tuesday, helps the US Dollar (USD) to regain positive traction and keeps a lid on any meaningful upside for the non-yielding Gold price, warranting some caution for bullish traders.
The US Census Bureau reported on Tuesday that Durable Goods Orders in the US rose for the third month in a row and jumped 1.7% in May, smashing consensus estimates for a decrease of 1%. Adding to this, the Conference Board’s Consumer Confidence Index climbed to 109.7 in June – the highest since January 2022 – from 102.5 in the prior month. Additional data showed that sales of new single‐family houses rose 12.2% in May and indicated that indicated the US housing market has been able to weather rising interest rates. This reaffirms expectations that the Fed will likely continue raising interest rates to slow demand in the overall economy.
Hence, the market focus will remain glued to Fed Chair Jerome Powell’s appearance at the ECB Forum on Central Banking in Sintra later this Wednesday. Investors will look for clues about the Fed’s future rate-hike path, which will play a key role in influencing the near-term USD price dynamics and provide a fresh directional impetus to the US Dollar-denominated Gold price. Nevertheless, the aforementioned fundamental backdrop suggests that the path of least resistance for the XAU/USD is to the downside and any meaningful intraday positive move is more likely to attract fresh sellers, rather runs the risk of fizzling out quickly.
From a technical perspective, bearish traders now await some follow-through selling below the $1,910 level before placing fresh bets. The Gold price might then turn vulnerable to weaken further below the $1,900 round-figure mark, towards testing the very important 200-day Simple Moving Average (SMA) support, around the $1,840 region, with some intermediate support near the $1,876-$1,875 zone.
On the flip side, immediate hurdle is pegged near the $1,926-$1,927 region, above which a bout of a short-covering could lift the Gold price towards the 100-day SMA support breakpoint, currently around the $1,942-$1,943 zone. This should act as a pivotal point, which if cleared could lift the XAU/USD towards the $1,962-$1,964 area en route to the $1,970-$1,972 region and the $1,983-$1,985 barrier. This is followed by the $2,000 psychological mark and the next relevant resistance near the $2,010-$2,012 zone.
Technical Levels: Supports and Resistances
XAUUSD currently trading at 1915.45 at the time of writing. Pair opened at 1913.74 and is trading with a change of 0.09 % .
| Overview | Overview.1 | |
|---|---|---|
| 0 | Today last price | 1915.45 |
| 1 | Today Daily Change | 1.71 |
| 2 | Today Daily Change % | 0.09 |
| 3 | Today daily open | 1913.74 |
The pair is trading below its 20 Daily moving average @ 1946.56, below its 50 Daily moving average @ 1974.04 , below its 100 Daily moving average @ 1943.21 and above its 200 Daily moving average @ 1855.8
| Trends | Trends.1 | |
|---|---|---|
| 0 | Daily SMA20 | 1946.56 |
| 1 | Daily SMA50 | 1974.04 |
| 2 | Daily SMA100 | 1943.21 |
| 3 | Daily SMA200 | 1855.80 |
The previous day high was 1930.75 while the previous day low was 1910.93. The daily 38.2% Fib levels comes at 1918.5, expected to provide resistance. Similarly, the daily 61.8% fib level is at 1923.18, expected to provide resistance.
Note the levels of interest below:
- Pivot support is noted at 1906.2, 1898.65, 1886.38
- Pivot resistance is noted at 1926.02, 1938.29, 1945.84
| Levels | Levels.1 |
|---|---|
| Previous Daily High | 1930.75 |
| Previous Daily Low | 1910.93 |
| Previous Weekly High | 1958.85 |
| Previous Weekly Low | 1910.18 |
| Previous Monthly High | 2079.76 |
| Previous Monthly Low | 1932.12 |
| Daily Fibonacci 38.2% | 1918.50 |
| Daily Fibonacci 61.8% | 1923.18 |
| Daily Pivot Point S1 | 1906.20 |
| Daily Pivot Point S2 | 1898.65 |
| Daily Pivot Point S3 | 1886.38 |
| Daily Pivot Point R1 | 1926.02 |
| Daily Pivot Point R2 | 1938.29 |
| Daily Pivot Point R3 | 1945.84 |
[/s2If]
Nehcap Expert Advisor
The NEHCAP MT4 EA is high quality professional trading system geared to generate returns without using GRID or martingales. Each trade has strict risk per trade parameter. The pairs under management include EURUSD, GBPUSD, AUDCAD, AUDNZD,GBPAUD, EURAUD, EURCAD, CHFJPY and many more.
The system is trading live: LIVE ACCOUNT TRACKING
You can run it free. Apply for a free trial and track our account. Buy the system or use profit share mechanism to generate returns on your MT4.
Join Our Telegram Group
")


